Analytics
The Analytics view provides statistics and analysis tools.
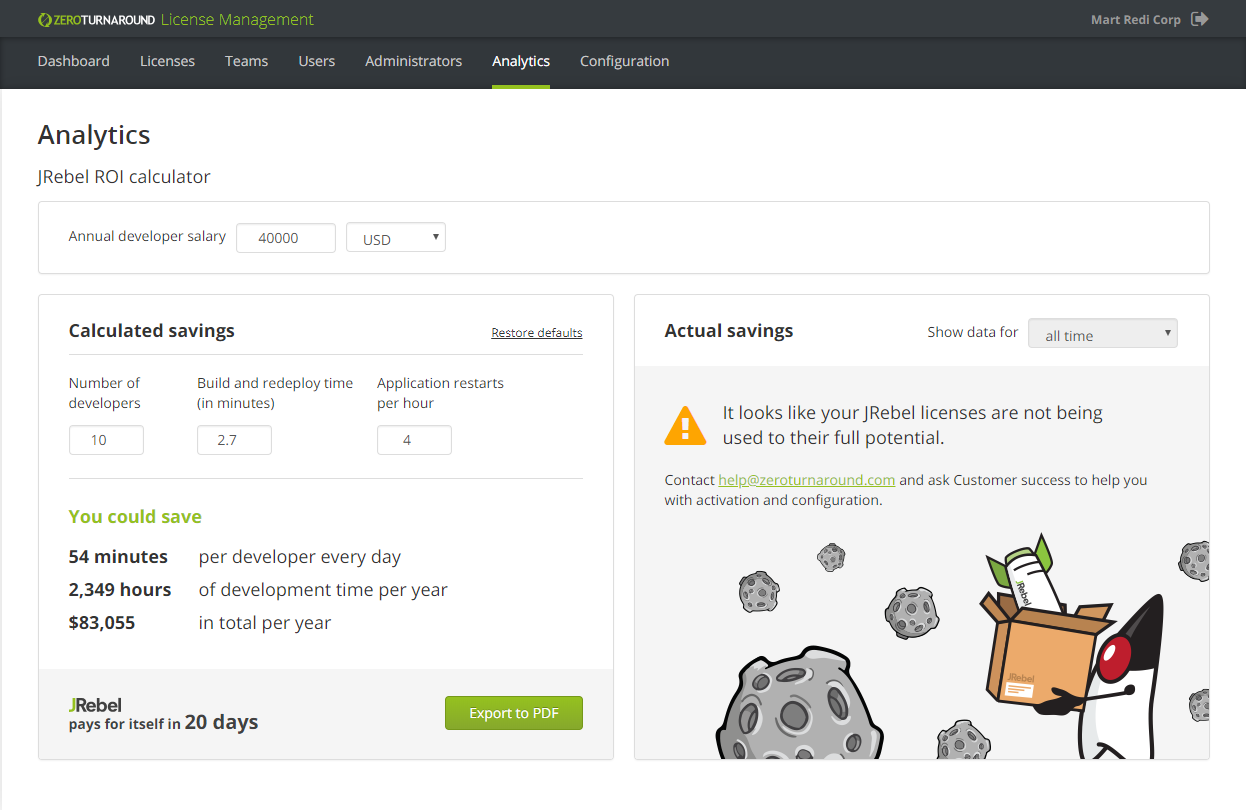
JRebel ROI calculator
The JRebel ROI calculator helps calculate how much time and money using JRebel can save you.
Specify the following details for an accurate approximation:
Annual developer salary: Enter the average developer salary for your JRebel users (default: 40,000 USD). Select USD or EUR as the currency.
Number of developers: Enter the total number of developers using JRebel at your company (default: total number of JRebel licenses currently active in your account).
Build and redeploy time (min): Enter the average build and redeploy time for your average developer workstation, application, and workspace in minutes (default: 2.7).
Redeploy frequency: Enter how many application restarts your developers need to perform per hour (default: 4).
Click Restore defaults to restore system default values.
Click Export to PDF to export the current calculation result as a PDF document.
The JRebel Saved you section shows the amount of time and redeploys saved by using JRebel.
Configuration
In the Actual savings section, press the Configuration link to update the default redeploy time for each team and show more accurate time savings.
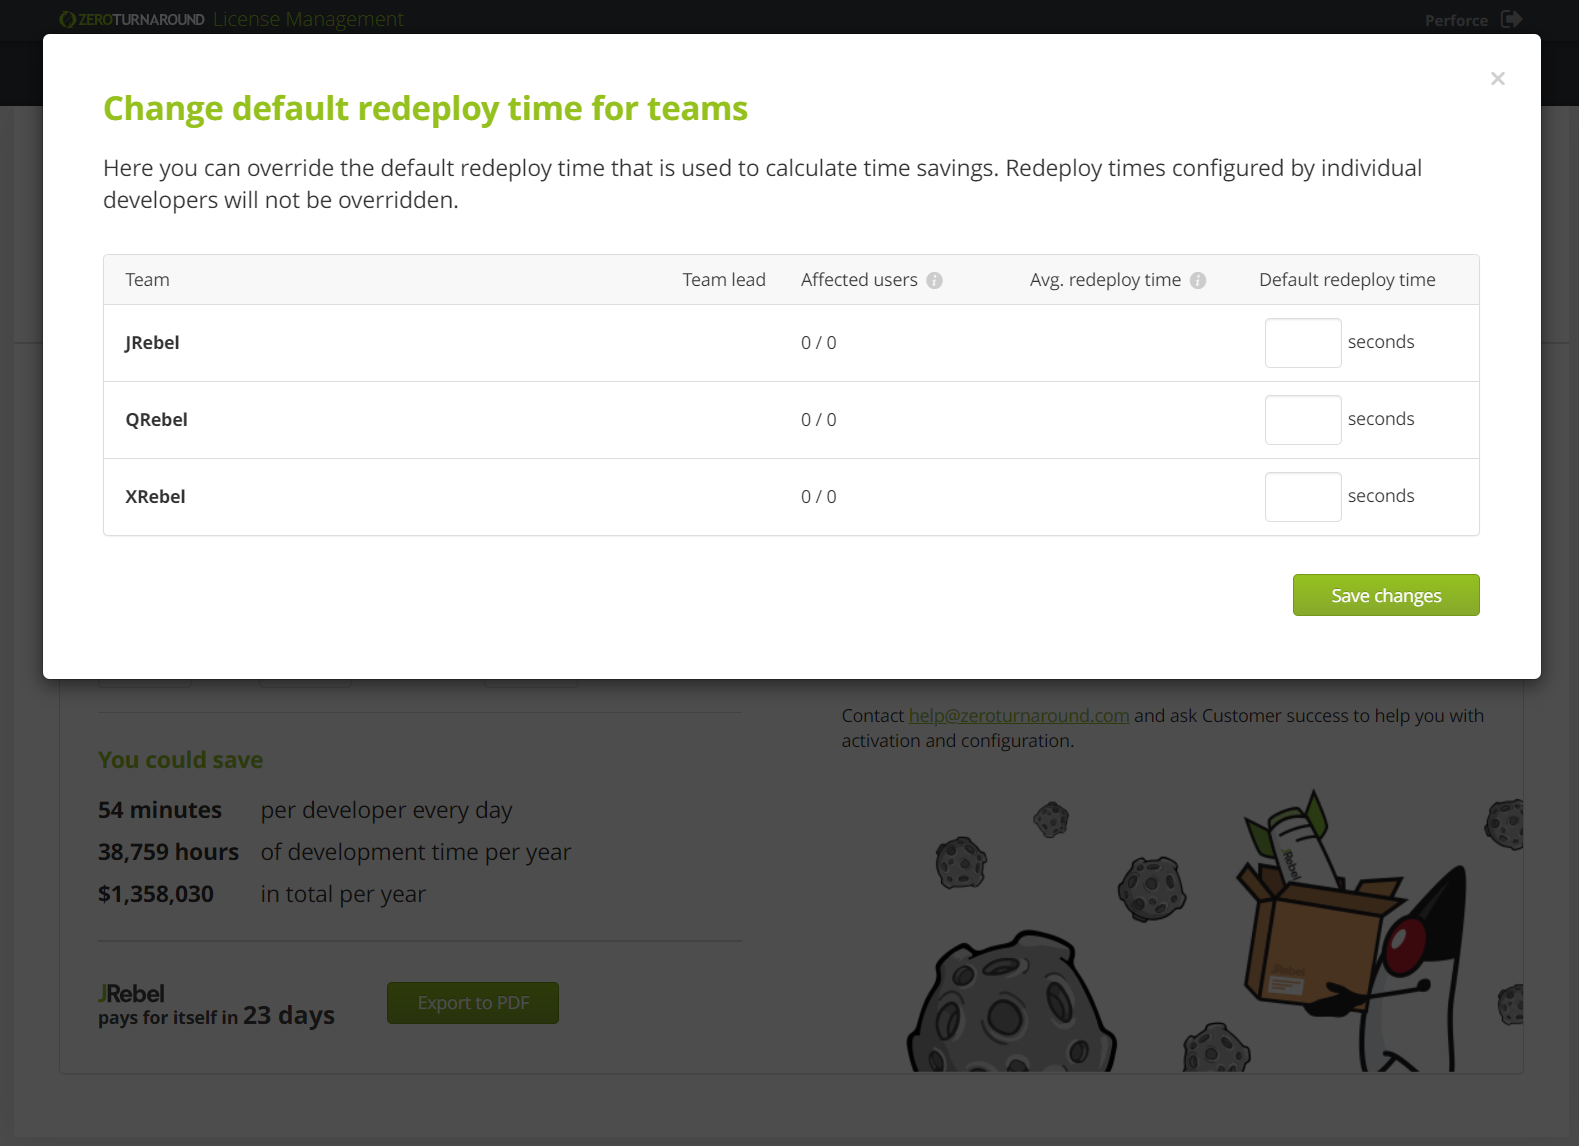
Learn more about Default redeploy time.
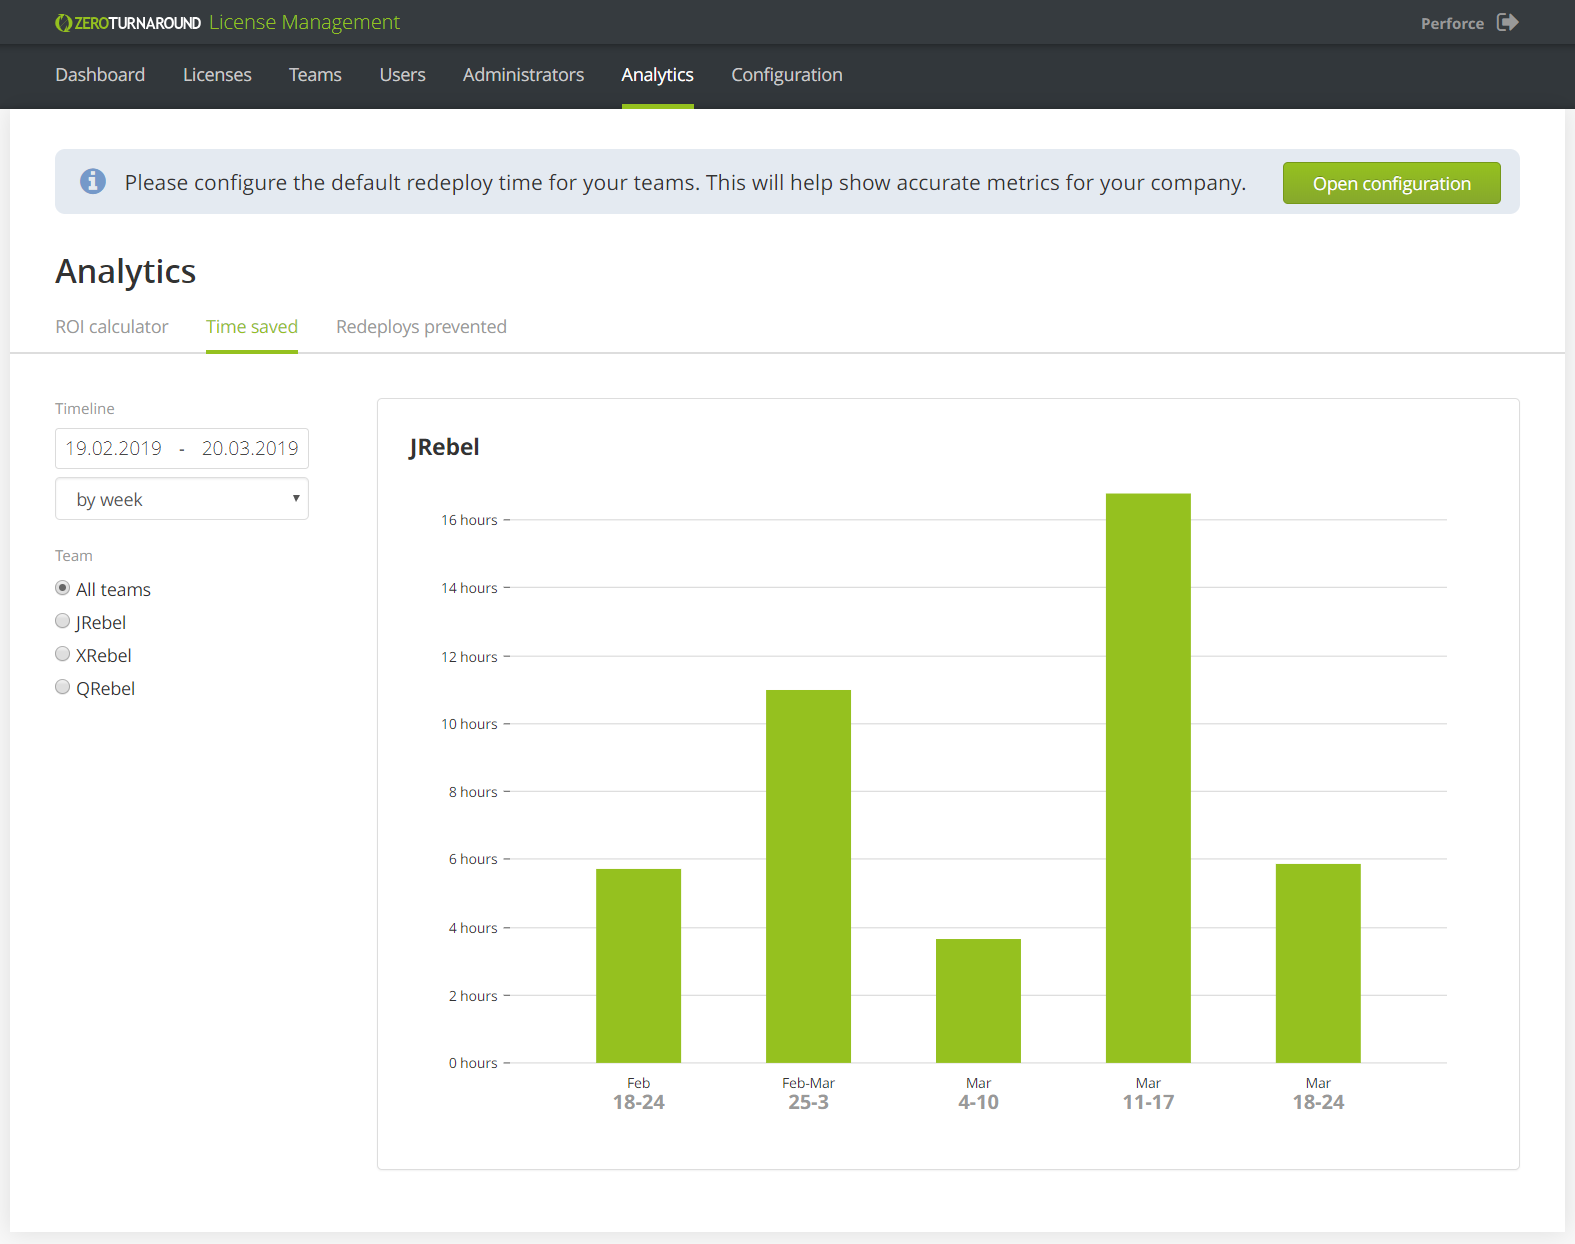
Time saved
See how much value JRebel adds to your organization over time with the Time saved graph.
Hover on a specific bar to see the exact time savings for that period. You can configure the following:
Timeline: Specify the time period.
Granularity: See time savings per day, per week, or per month.
Team: Specify which team’s graph you want to see (default: All teams).
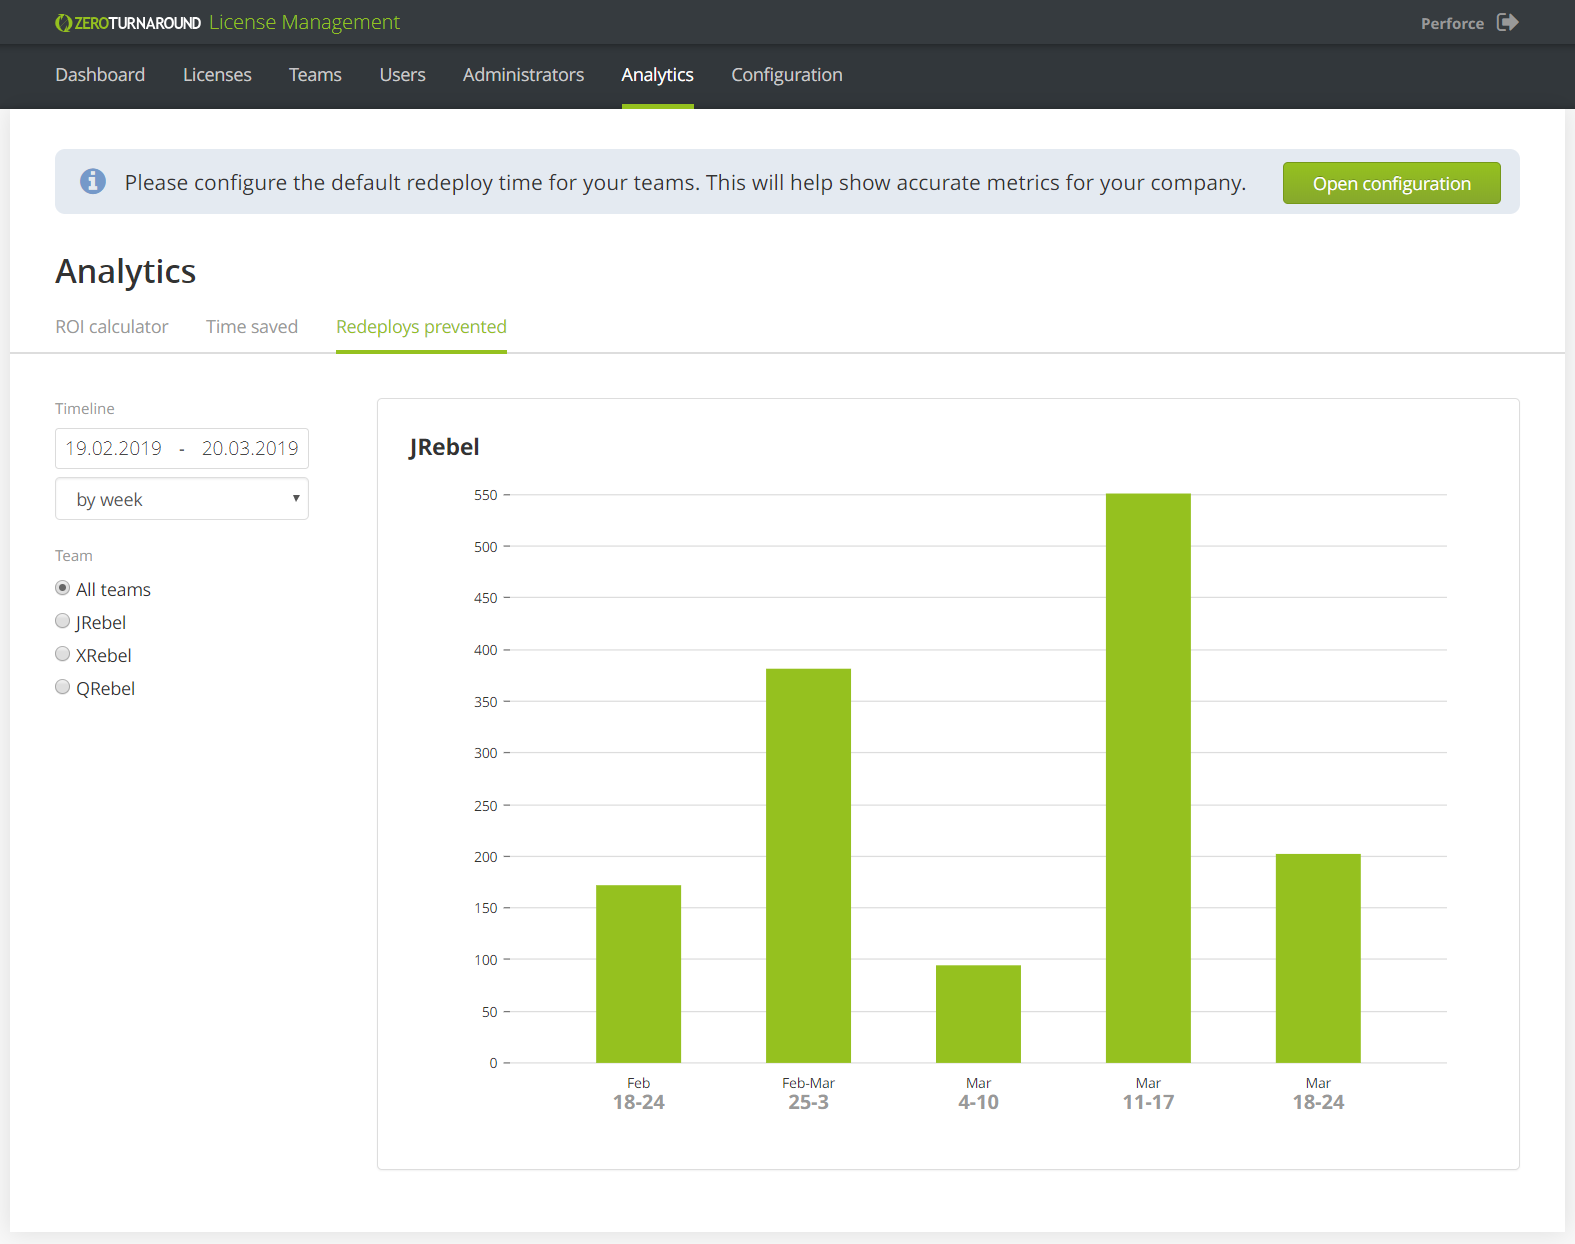
Redeploys prevented
View how many redeploys were prevented over time with the Redeploys prevented graph.
Hover on a specific bar to see the exact number of redeploys prevented for that period. You can configure the following:
Timeline: Specify the time period.
Granularity: See redeploys prevented per day, per week, or per month.
Team: Specify which team’s graph prevented you want to see (default: All teams).