Using XRebel
Toolbar
Once an application is started with XRebel, a vertical toolbar is displayed in the bottom left of the application window. Pressing toolbar buttons opens the relevant view or menu.
Pressing any toolbar button opens the desired view or menu.
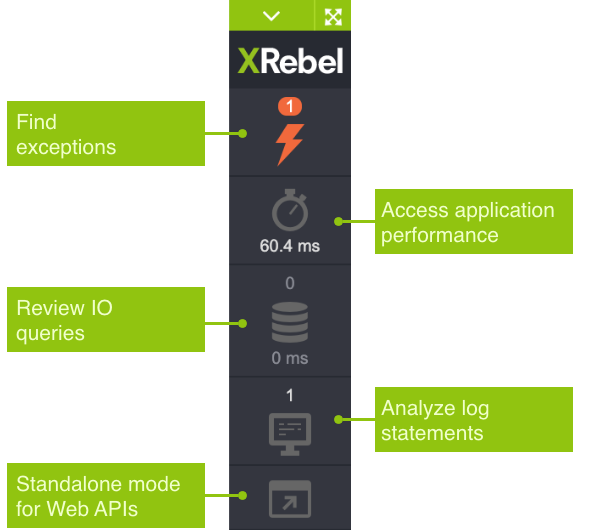
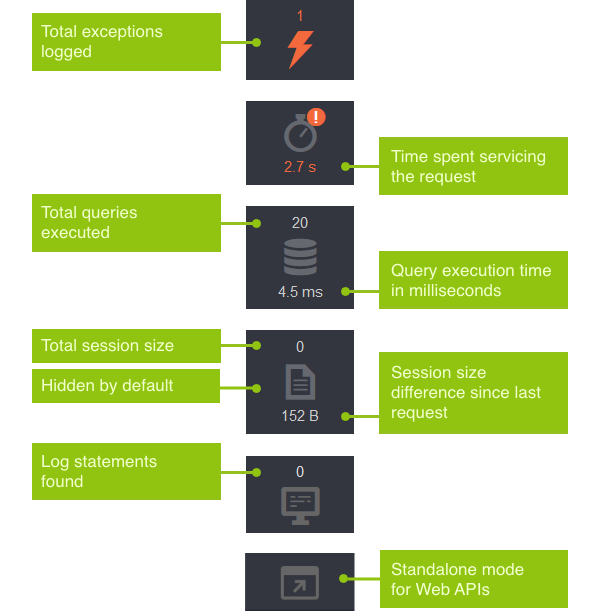
The relevant metrics are displayed next to the toolbar buttons.
You can quickly clear all views by pressing the Clear button at the bottom of the toolbar. Doing this will not empty the Session view (when enabled).

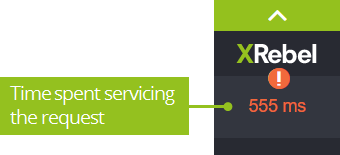
You can press the top of the toolbar to hide it from view. To restore the toolbar, simply press the top part of the visible toolbar again. When minimized, the toolbar displays relevant data, including hitting thresholds, exceptions and application performance.
Note
Your application does not have a front-end? Maybe you cannot inject the toolbar into the application? Add /xrebel/ at the end of your application URL. Read more here.
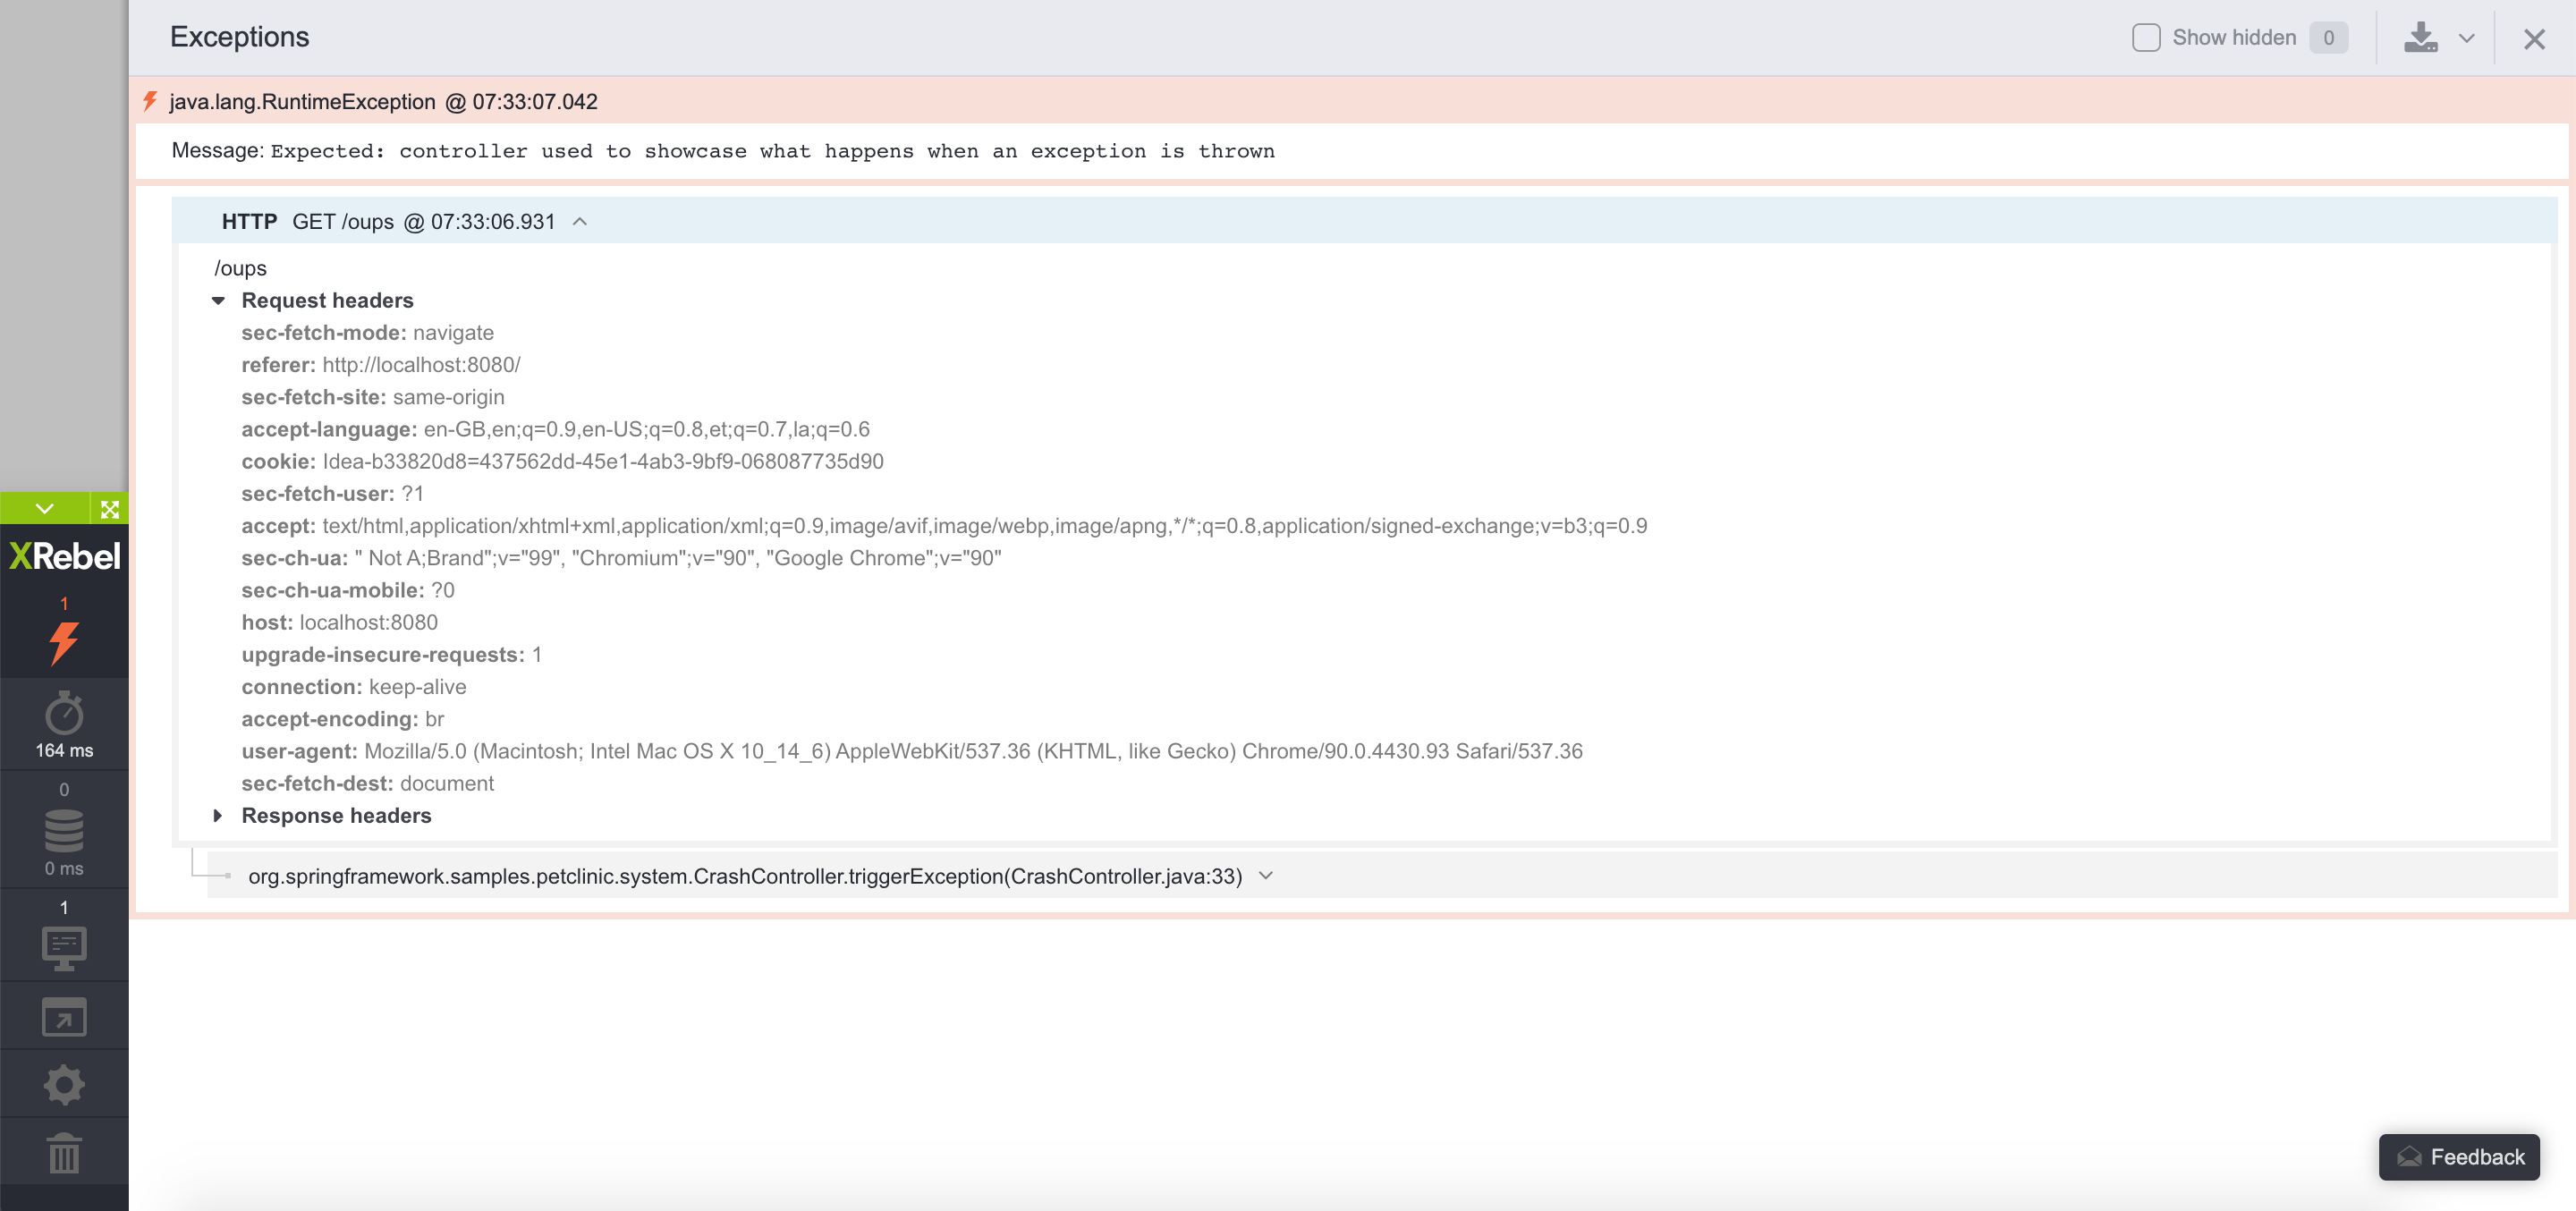
Exceptions log
XRebel monitors the occurrence of exceptions inside the application. This log displays the exceptions in a chronological order. The exception stack trace is rendered in an inverse order – the root cause of the exception is rendered first. The exceptions that wrap the original cause are rendered following the root cause.
 opens the relevant exception in the Calls view.
Collapse all
Press the  collapse button in the top left to quickly collapse all expanded nodes.
Move Toolbar
Press the  move toolbar button to select location you would like to reposition toolbar to.
Application performance
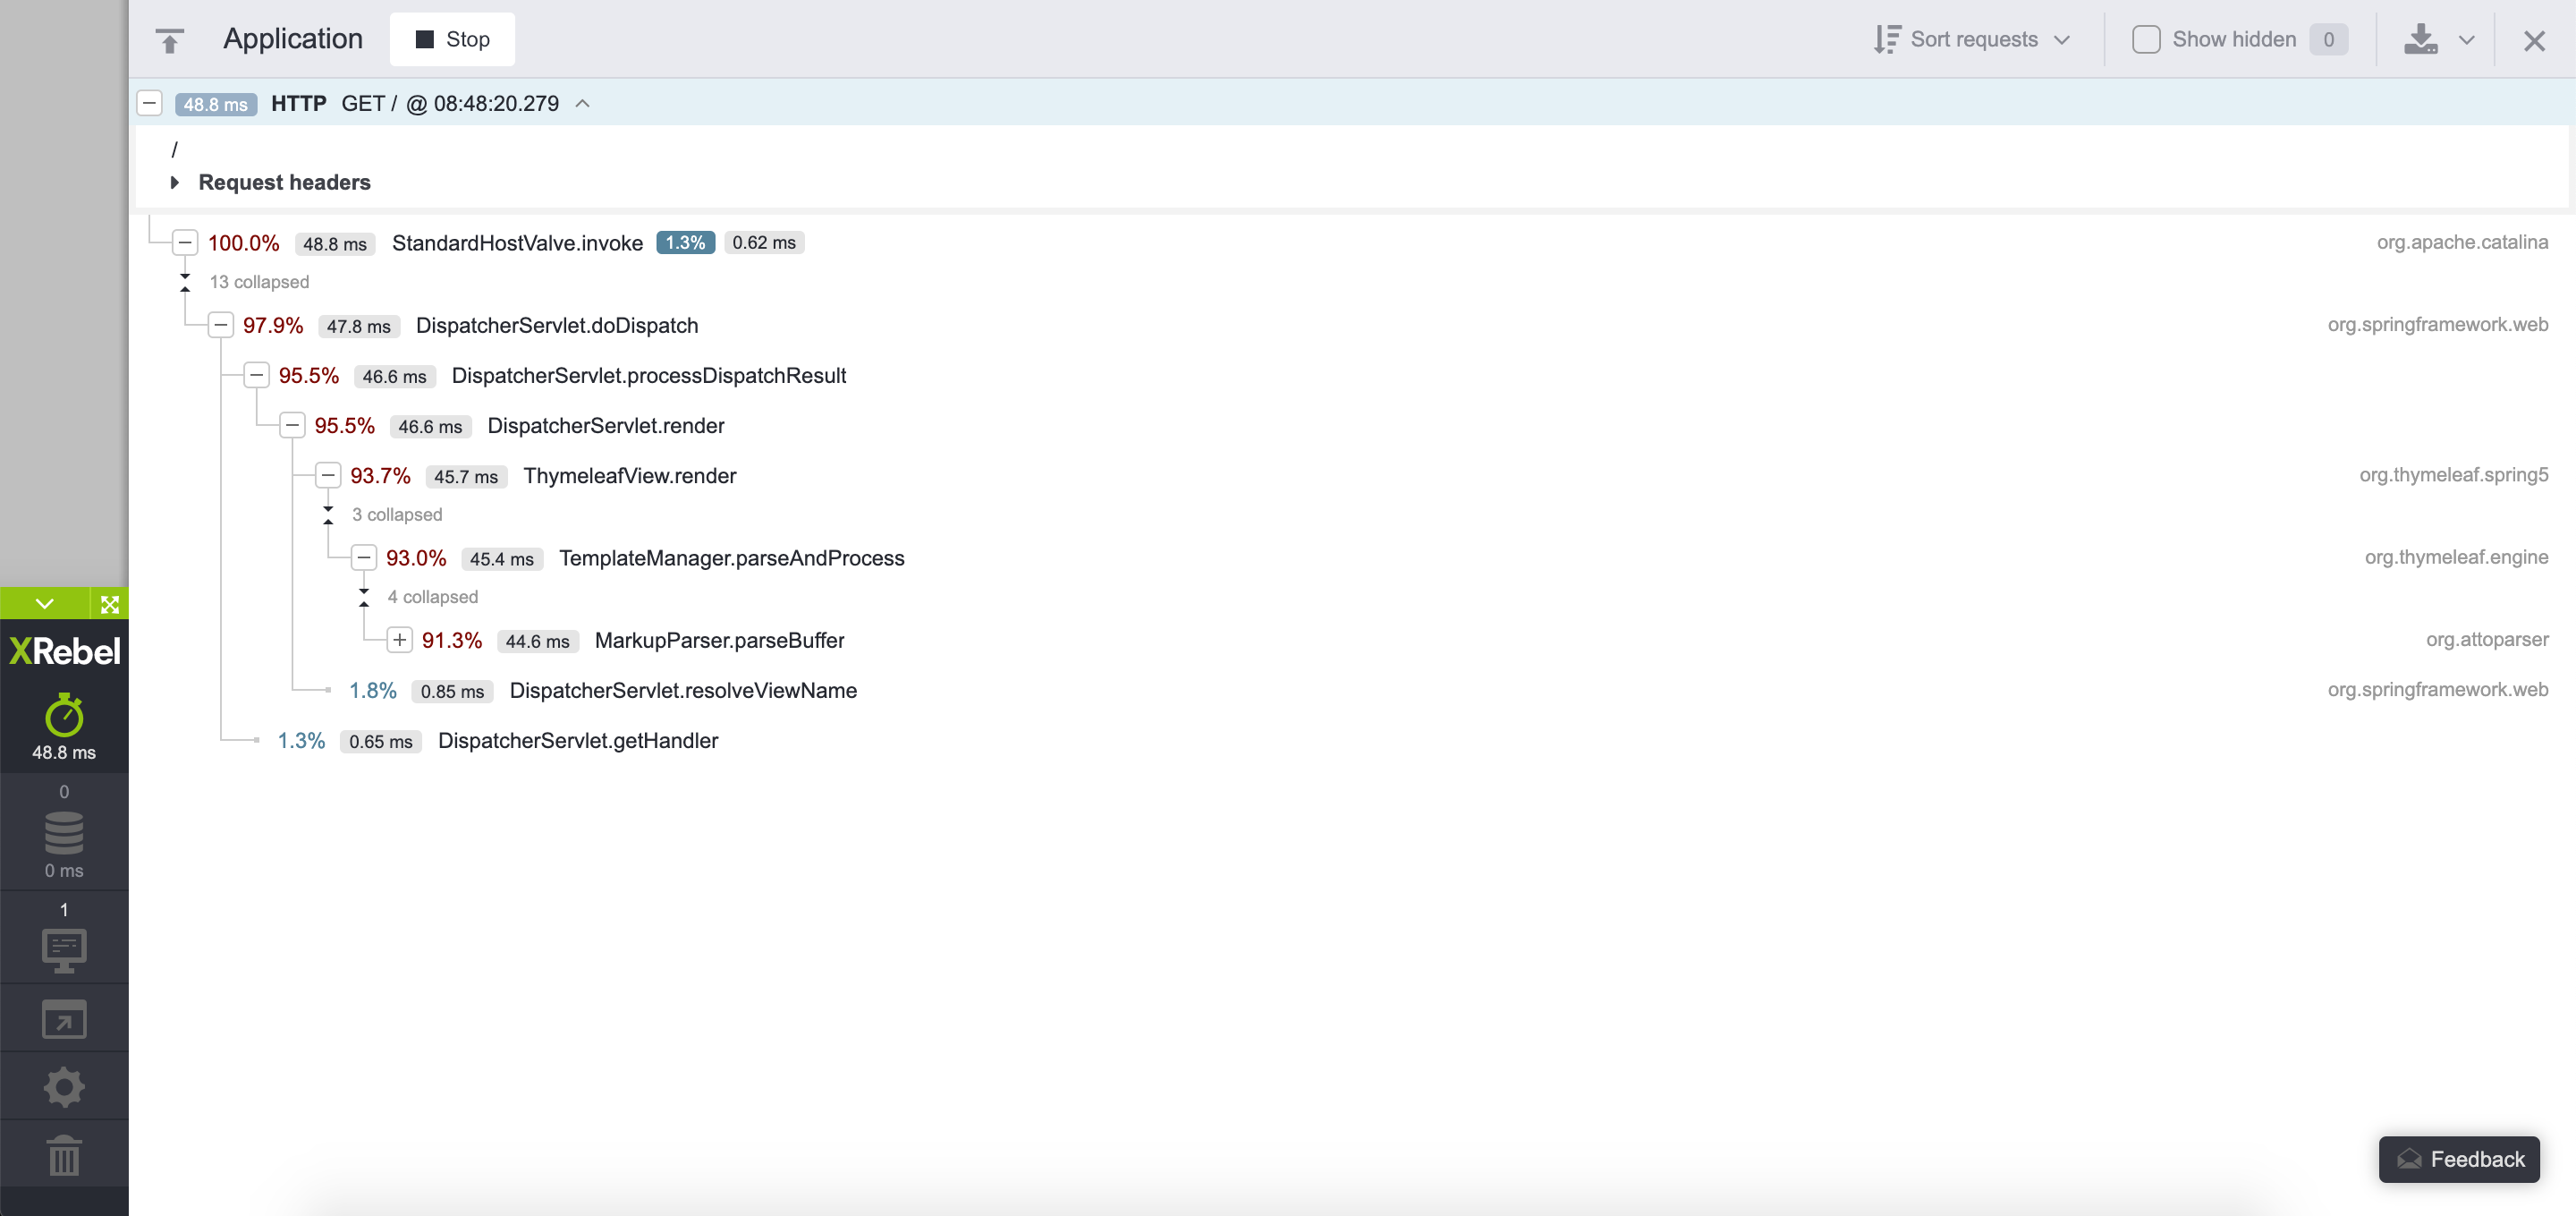
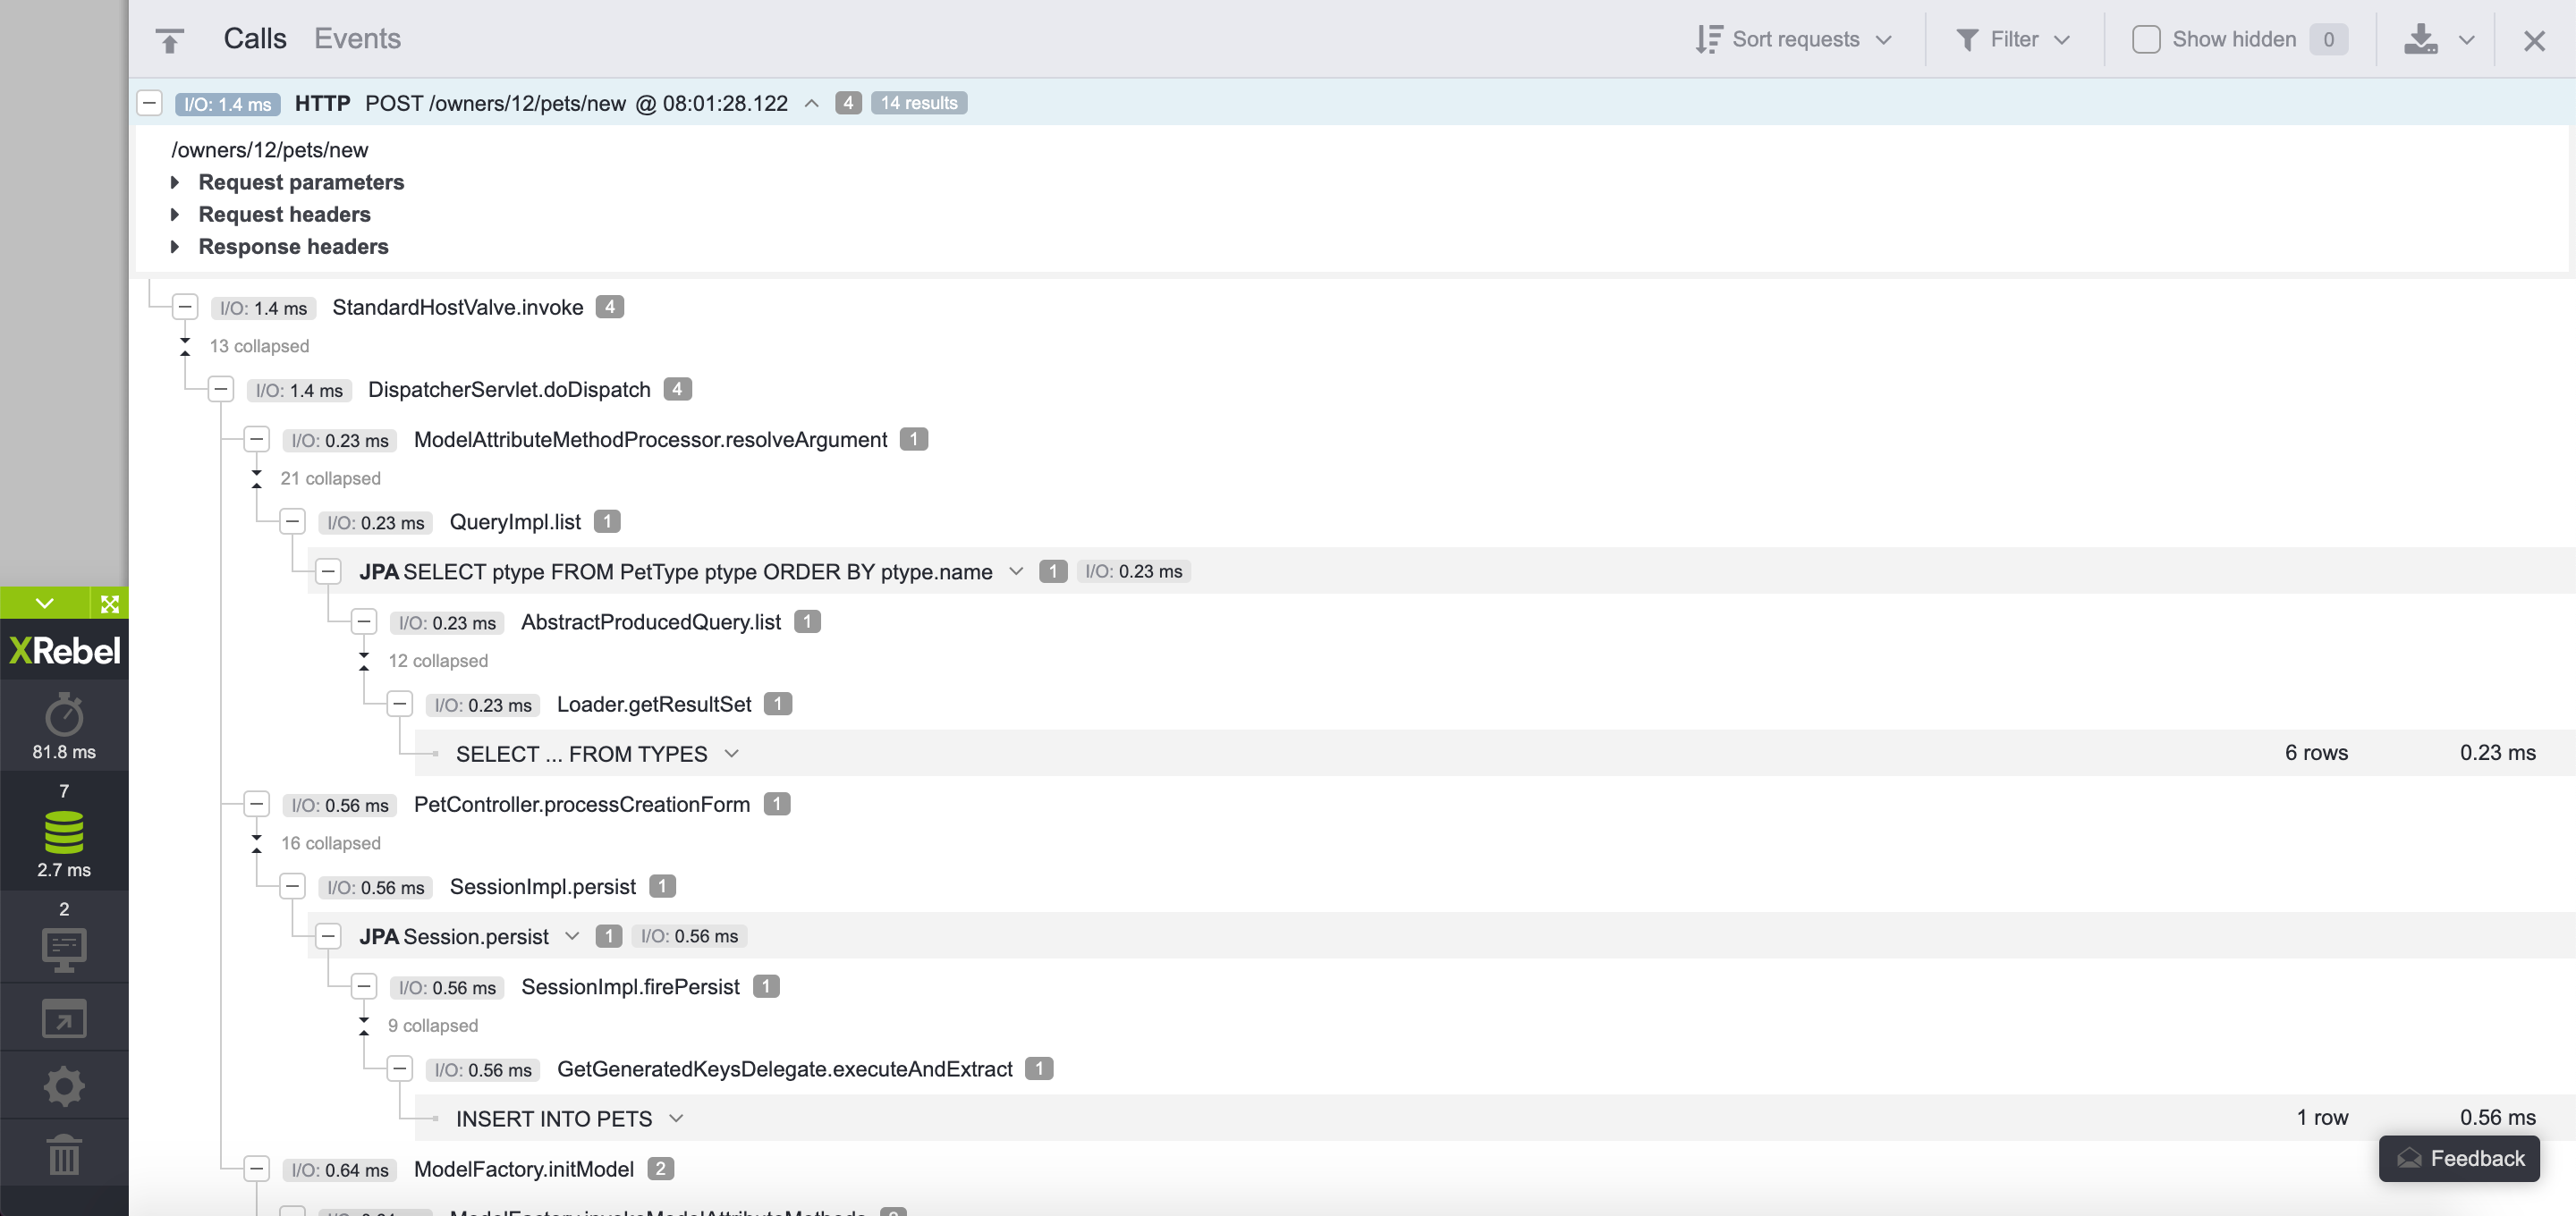
XRebel monitors application performance. This view displays a complete breakdown of all requests being serviced. The requests are displayed in a descending order based on their duration. The displayed requests can be expanded to view the time spent in each specific branch or method. The IO queries are also displayed in this view.
Press the Application performance button (topmost) on the XRebel toolbar to open this view.
Press the + and - buttons in front of the request details to expand or collapse additional information. Use the Sort requests feature in the header to further sort all results.
Here is a breakdown of the visuals for this view:
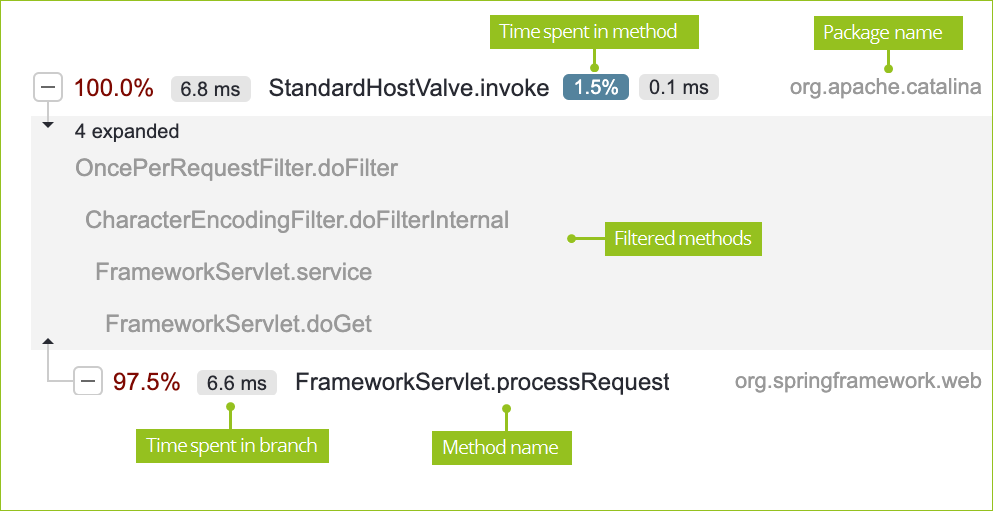
Time spent in branch – The total percentage of time spent in the current branch.
Request name – The full name of the request being executed during this time.
Package name – The first two elements of the package name that the current request belongs to. Hover over this name to view the full name of the package. The package name is valid for all the following lines, until a new package name is displayed.
Filtered methods – Press the area between the visible methods (designated with caret symbols) to view filtered methods that do not substantially contribute to the time effort (less than 1%). These filtered methods are displayed to reveal the connection between the two substantial methods.
Time spent in method – The highlighted percentage and absolute time displays the time spent in the specific method shown on line.
 icon marks transactions that originate from microservice applications run with XRebel enabled.
Note
JSP items are displayed with a special JSP tag. These items list the JSP file name, path, attributes, and how much time these contribute to the overall duration.
Tip
You can stop monitoring application performance by pressing the Stop button in the view header. When stopped, only basic information is displayed. The toolbar icon for application performance will display the label Stopped. Press Start in the view header to enable in-depth analysis.
Hidden items
Select the Show hidden option in the upper right corner to display all items you have previously marked to be hidden from view. The number next to the hidden items selection shows how many items are currently hidden from view.
To add items to the hidden items list, hover over the desired item with your mouse and click the context menu  button. Select Hide this item. To remove the item from the hidden items list, select the Show hidden options to reveal it, hover over it with the mouse and press the show button
  .
.
Trace differences comparison
Press Compare on the right for any request and pick Select this request as baseline. The pinned request becomes the baseline for the comparison and is displayed in the header of the stack trace. Basic execution data like execution time is displayed immediately.
Re-executing the same request will immediately start the comparison with the pinned baseline request data:
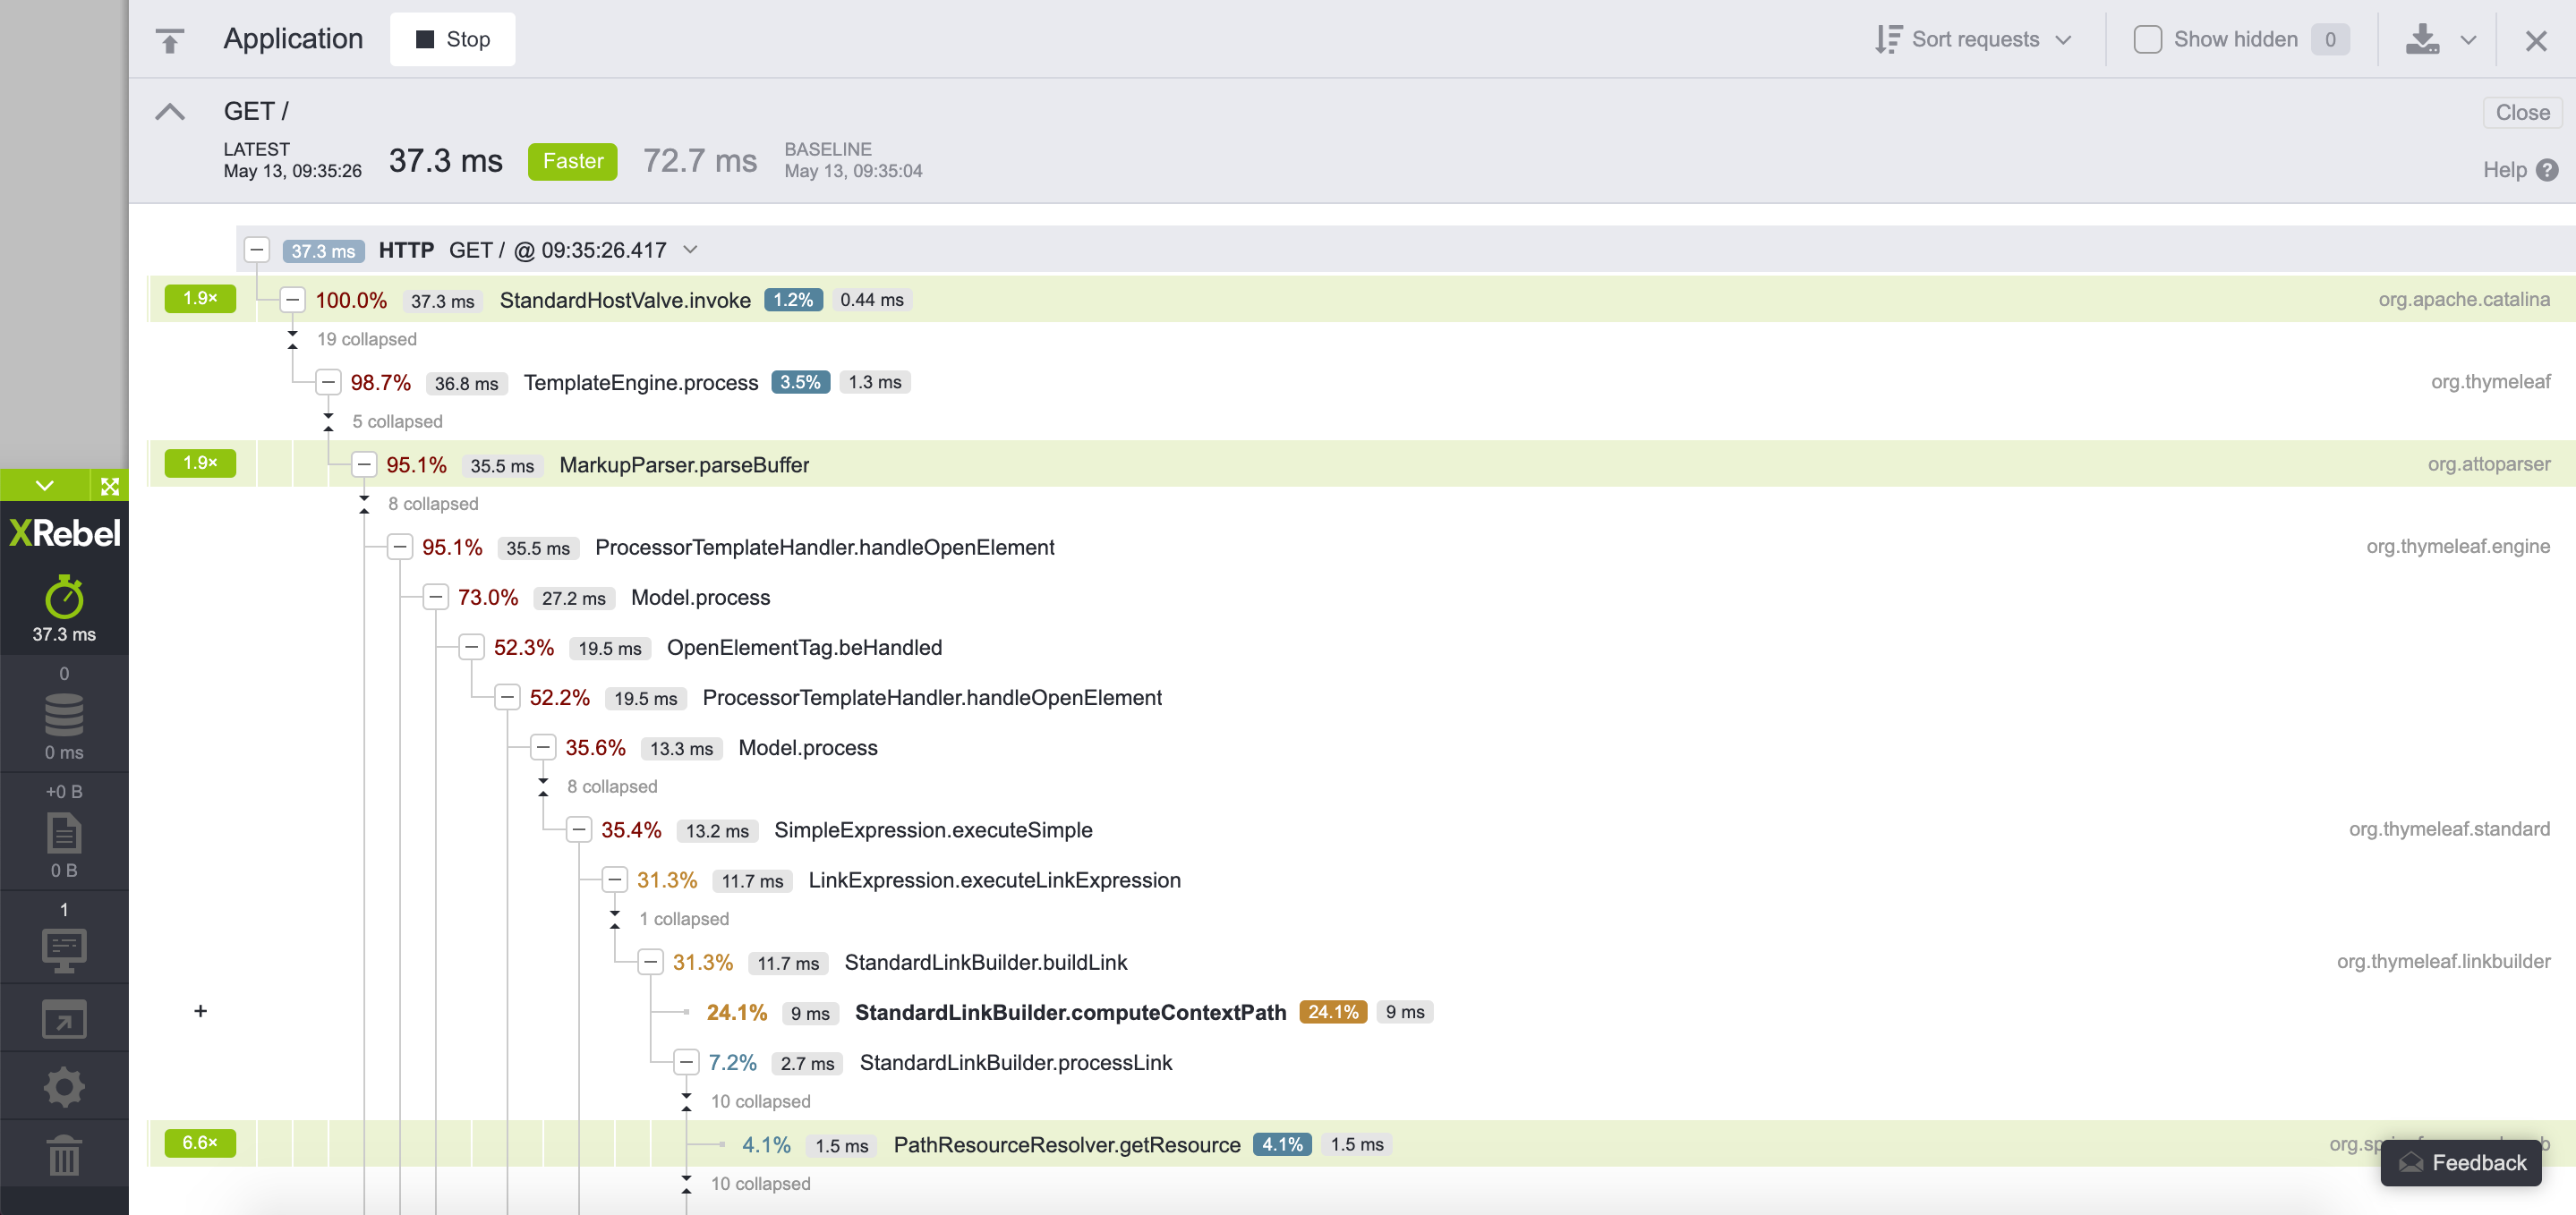
Past executions of the same request will be stored below the comparison view. Pressing any entry in the list will use that request execution analysis for the comparison against the pinned baseline. Hover over any differential view item to see an explanation for the changes. Hovering over the speed difference multiplier will provide additional comparison data. The pinned comparison baseline request persists in XRebel memory until manually closed by pressing Close.
Input and output
XRebel traces database queries execution regardless of the data access layer implementation – as long as it relies on JDBC. The input and output queries execution is presented in two views: Calls and Events.
Press the IO queries button on the XRebel toolbar to open this view.
Calls
The calls view presents a hierarchy of method invocations.
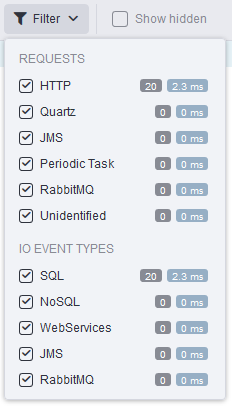
Filters
The top of the calls view contains the request and IO event type filters. All sources and types are displayed by default. To filter results, open the drop-down menu and select or deselect the desired options.
Hidden items
Select the Show hidden option in the upper right corner to display all items you have previously marked to be hidden from view. The number next to the hidden items selection shows how many items are currently hidden from view.
To add items to the hidden items list, hover over the desired item with your mouse and click the context menu button. Select Hide this item. To remove the item from the hidden items list, select the Show hidden options to reveal it, hover over it with the mouse and press the show button .
Calls view contents
The context for the execution of the queries is represented as the root of the invocation tree. Every node in the invocation tree represents a method call that leads to the execution of the query.
Two numbers are displayed next to every node: how many queries were executed under the current branch, and the cumulative time that was required to execute the queries. The leaves of the tree represent the individual queries, rendered with the provided query parameters. The calls are grouped based on the request. The groups are displayed based on the call timestamp.
The invocation tree is filtered according to the filtered packages configured in the settings view. When no packages are pre-configured, the invocation tree can become exceptionally deep, especially if an ORM (e.g. Hibernate) is used.
To add items to the hidden items list, hover over the desired item with your mouse and click the context menu button. Select Hide this item. To remove the item from the hidden items list, select the Show hidden options to reveal it, hover over it with the mouse and press the show button .
To quickly collapse all open nodes, press the collapse button in the upper left corner of the calls view.
Events
Sorting and filters
Open the Sort requests drop-down menu to further sort all results. The top of the calls view also contains the request and IO event type filters. All sources and types are displayed by default. To filter results, open the drop-down menu and select or deselect the desired options.
Hidden items
Select the Show hidden option in the upper right corner to display all items you have previously marked to be hidden from view. The number next to the hidden items selection shows how many items are currently hidden from view.
To add items to the hidden items list, hover over the desired item with your mouse and click the context menu button. Select Hide this item. To remove the item from the hidden items list, select the Show hidden options to reveal it, hover over it with the mouse and press the show button .
Events view contents
The events are displayed as a list. The individual events are displayed in the order of their occurrence. They are also grouped based on name.
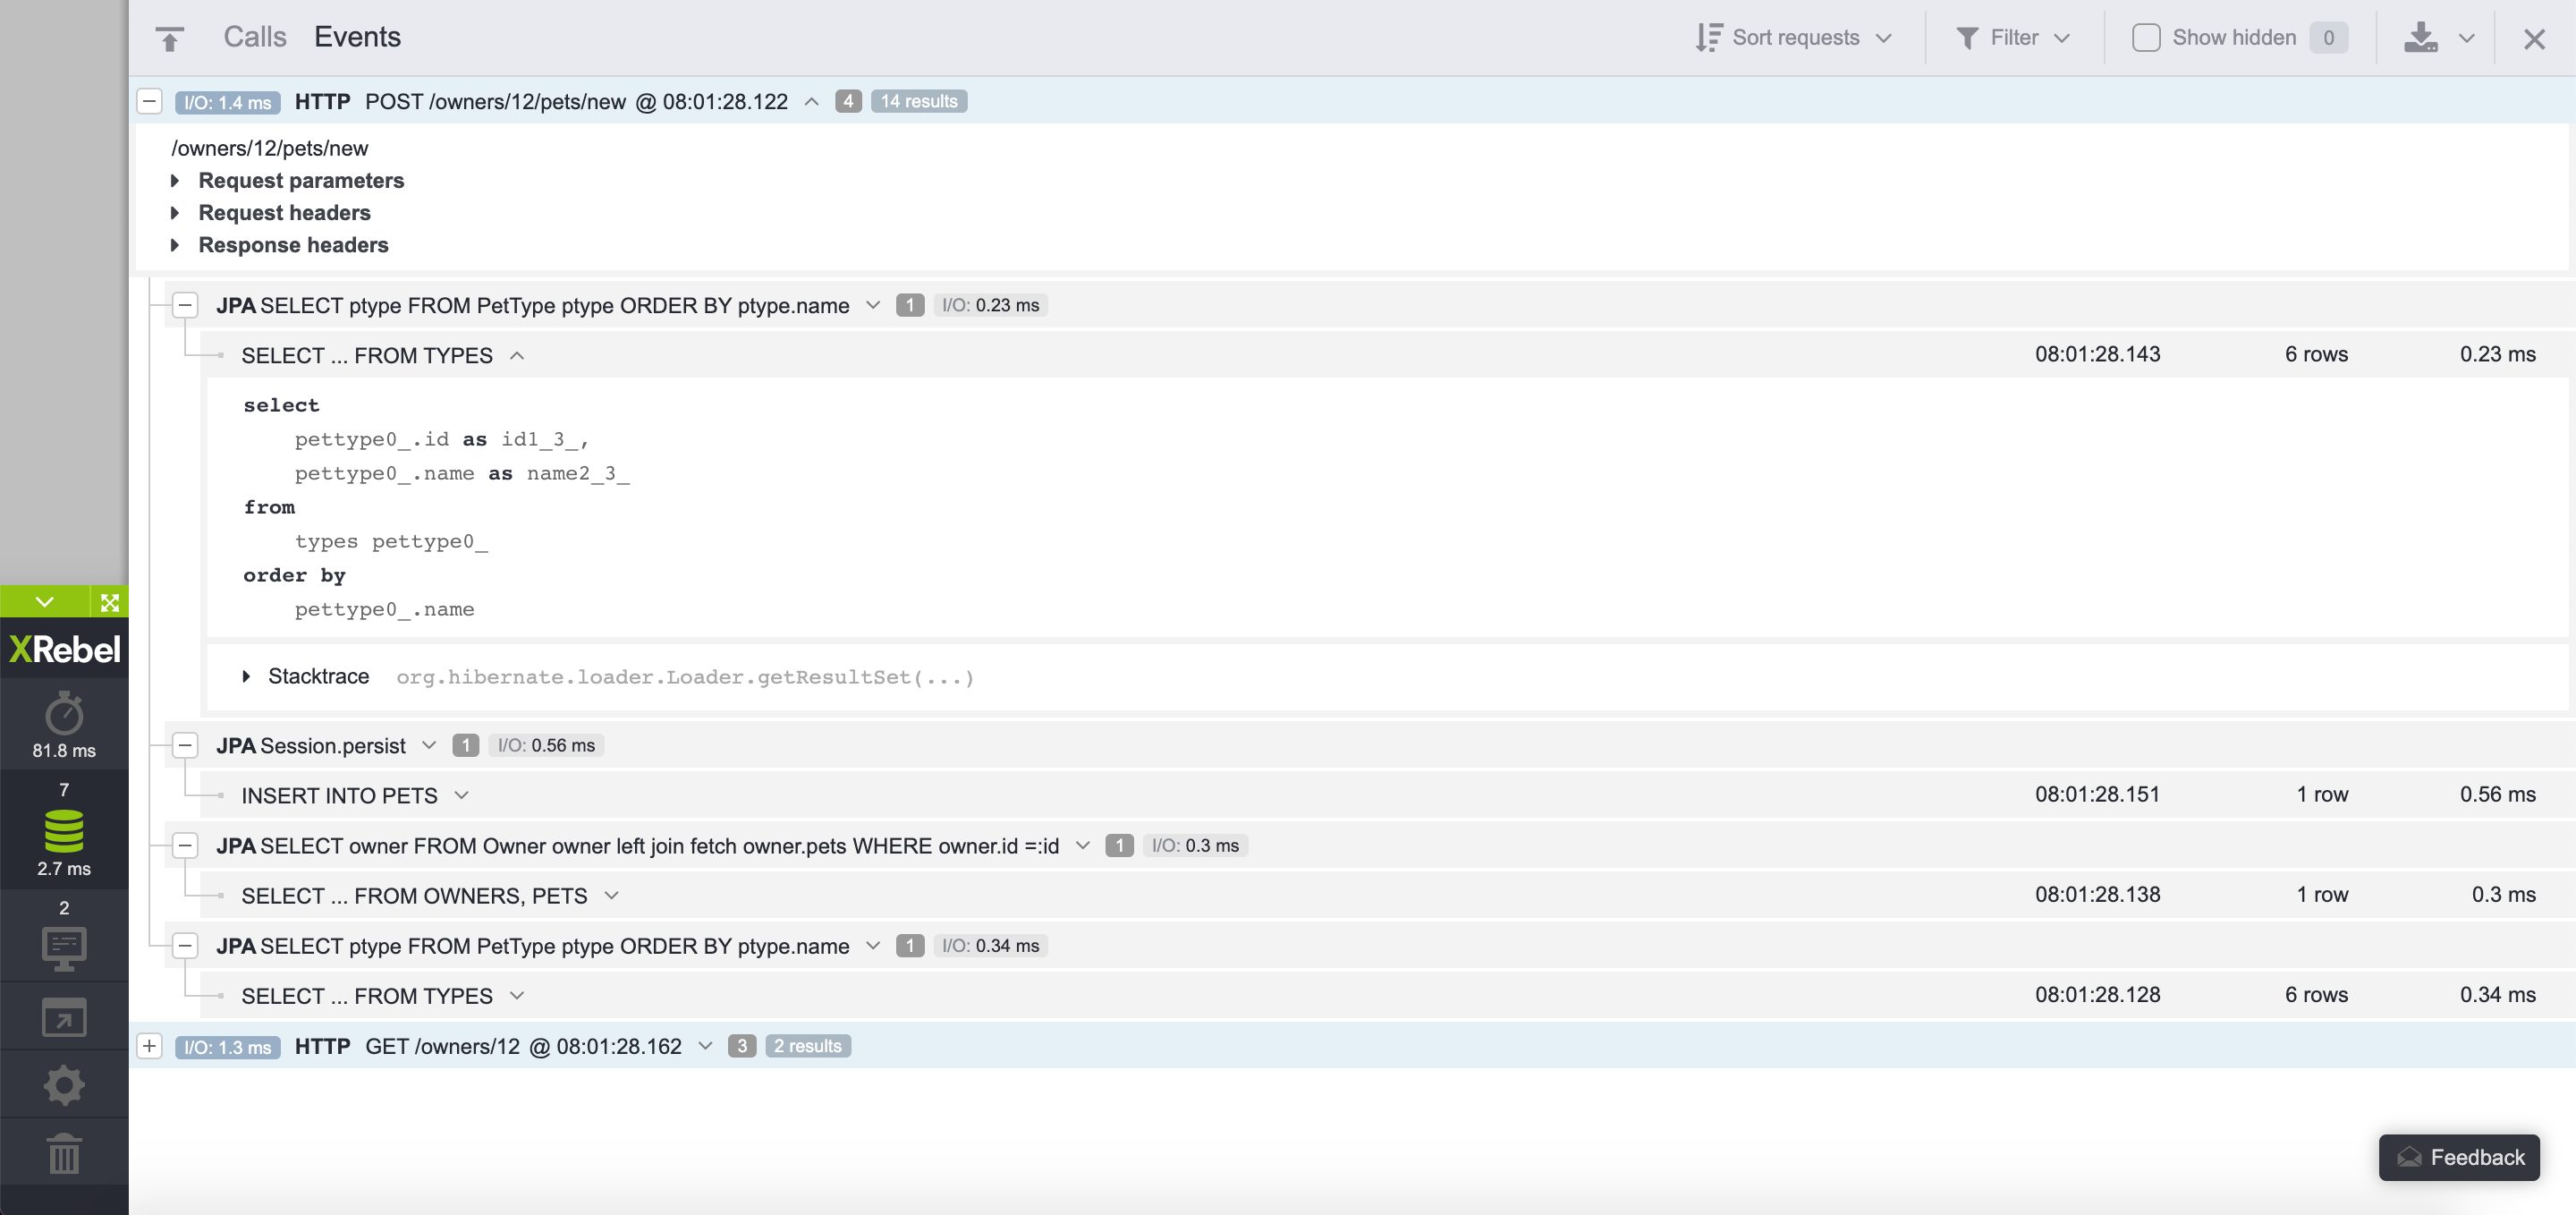
Along with the event itself, there is a filtered stack trace provided for the user to quickly understand where the event occurred.
To quickly collapse all open nodes, press the collapse button in the upper left corner of the view.
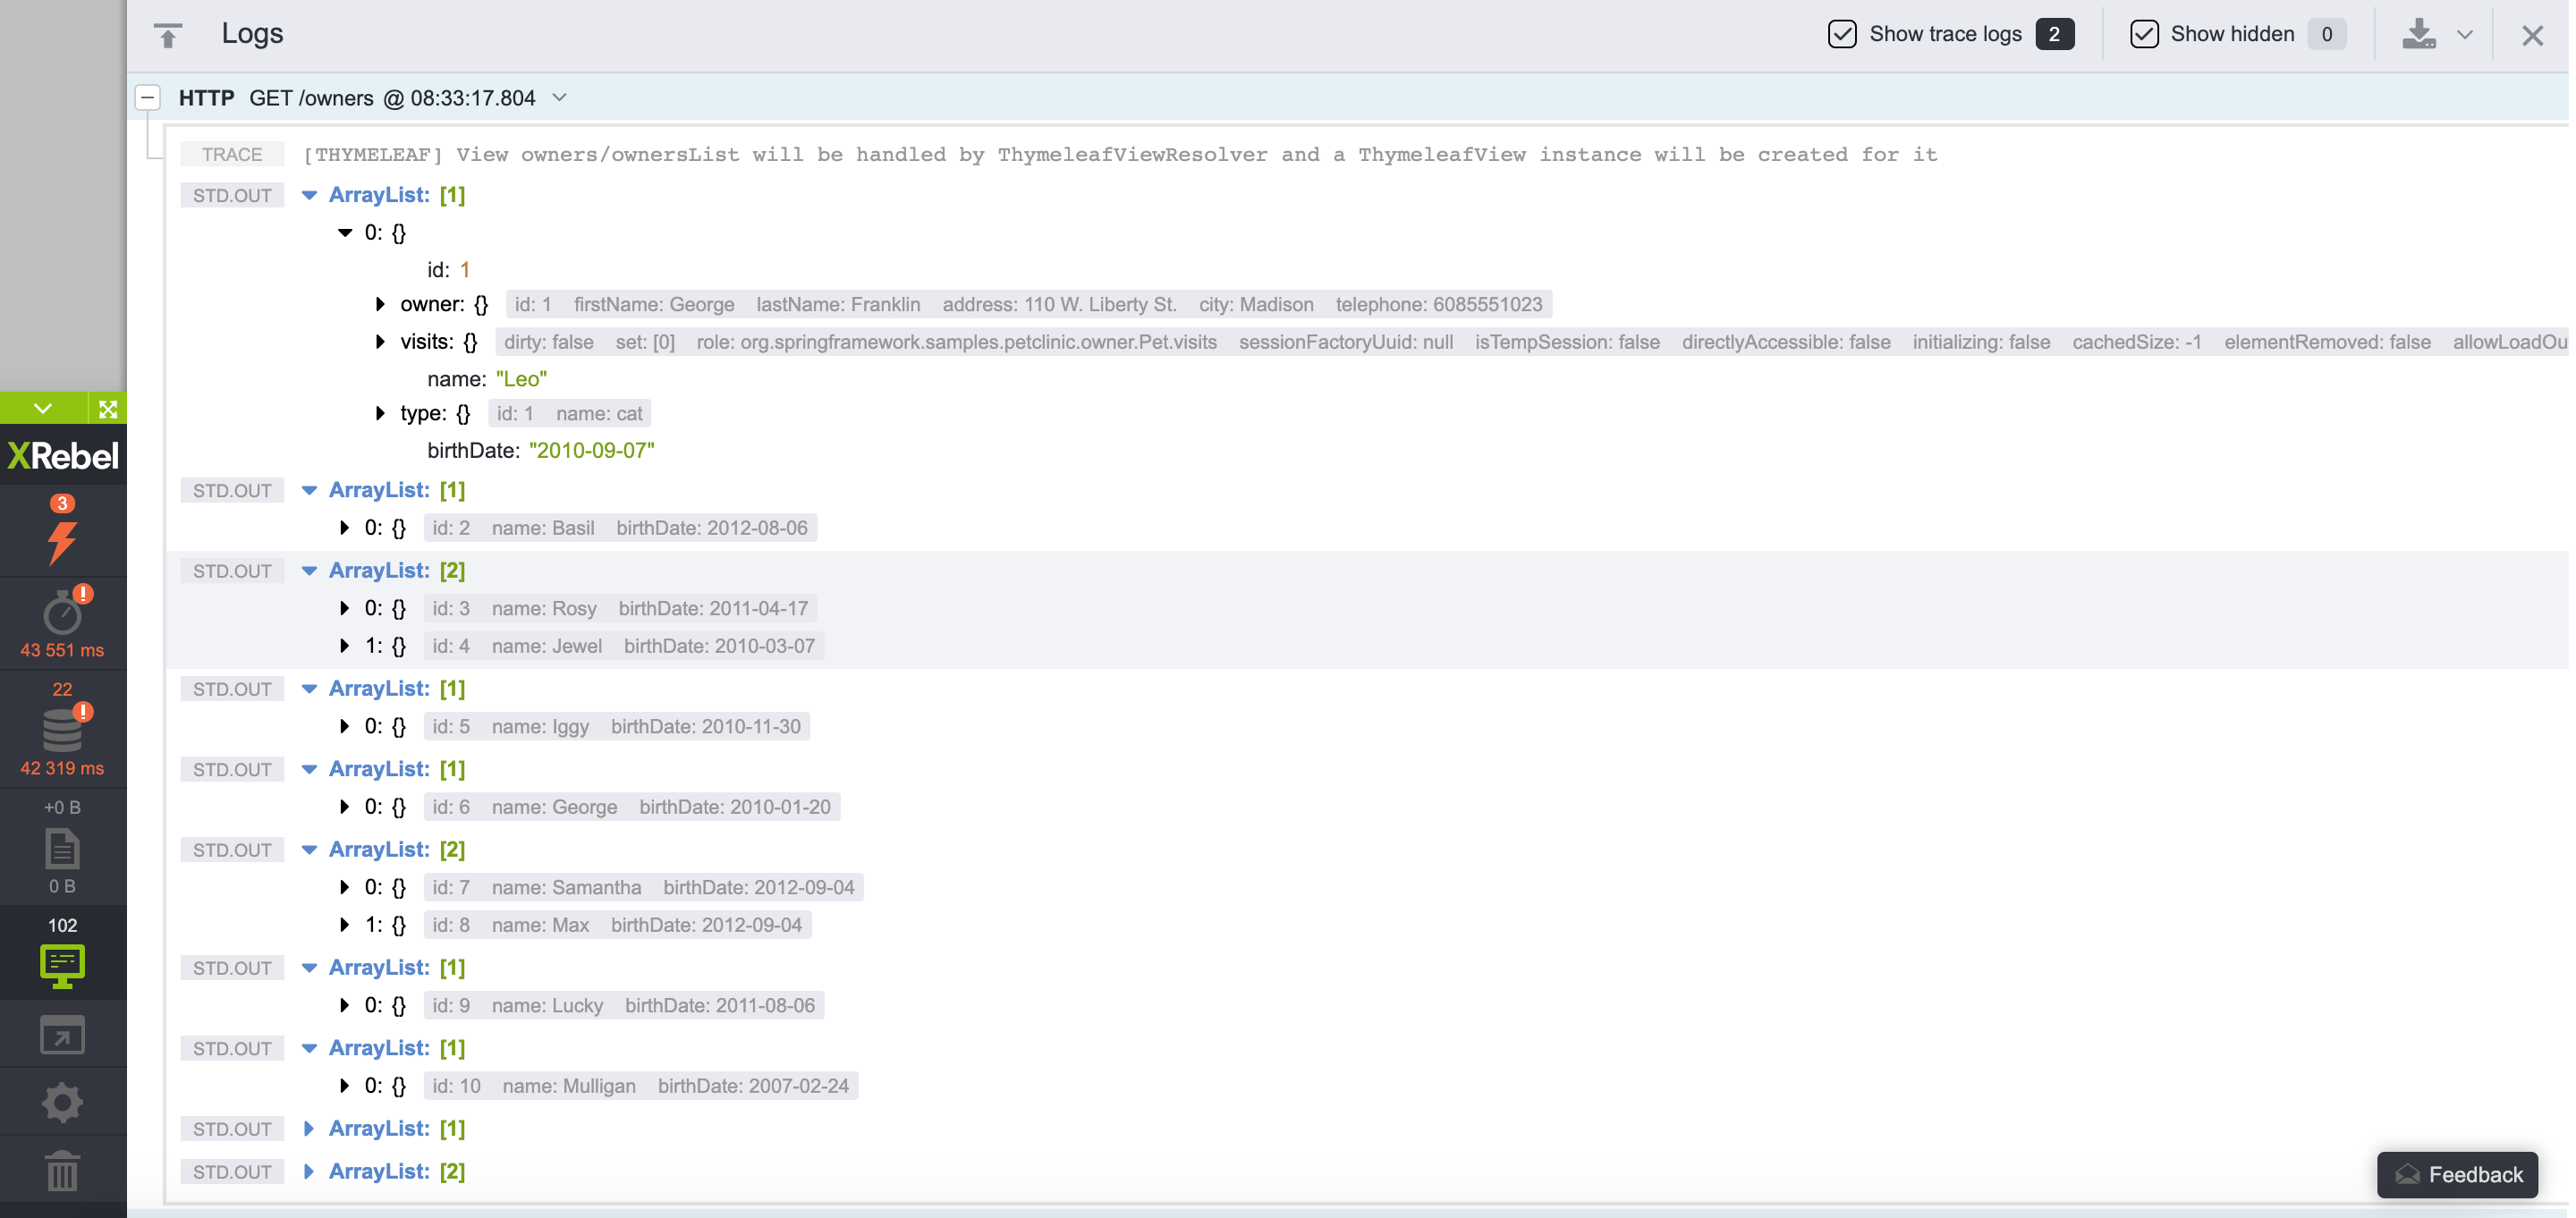
Logs
XRebel can detect log statements for debugging purposes. The log statements are rendered based on requests. End-to-end remote request log statements are also detected. Select Show trace log on the toolbar to include trace level log statements.
Note
As of XRebel 3.3.2, System.out.println and System.err.println statements are detected. The logging view supports the SLF4J logging framework.
Hidden items
Select the Show hidden option in the upper right corner to display all items you have previously marked to be hidden from view. The number next to the hidden items selection shows how many items are currently hidden from view.
To add items to the hidden items list, hover over the desired item with your mouse and click the context menu button. Select Hide this item. To remove the item from the hidden items list, select the Show hidden options to reveal it, hover over it with the mouse and press the show button .
Collapse all
Press the collapse button in the top left to quickly collapse all expanded nodes.
Feedback
You can quickly send feedback and your XRebel logs to the development team. To do this, open the feedback view, fill out the form and press Send.
Press the Feedback button at the bottom right of any XRebel view.
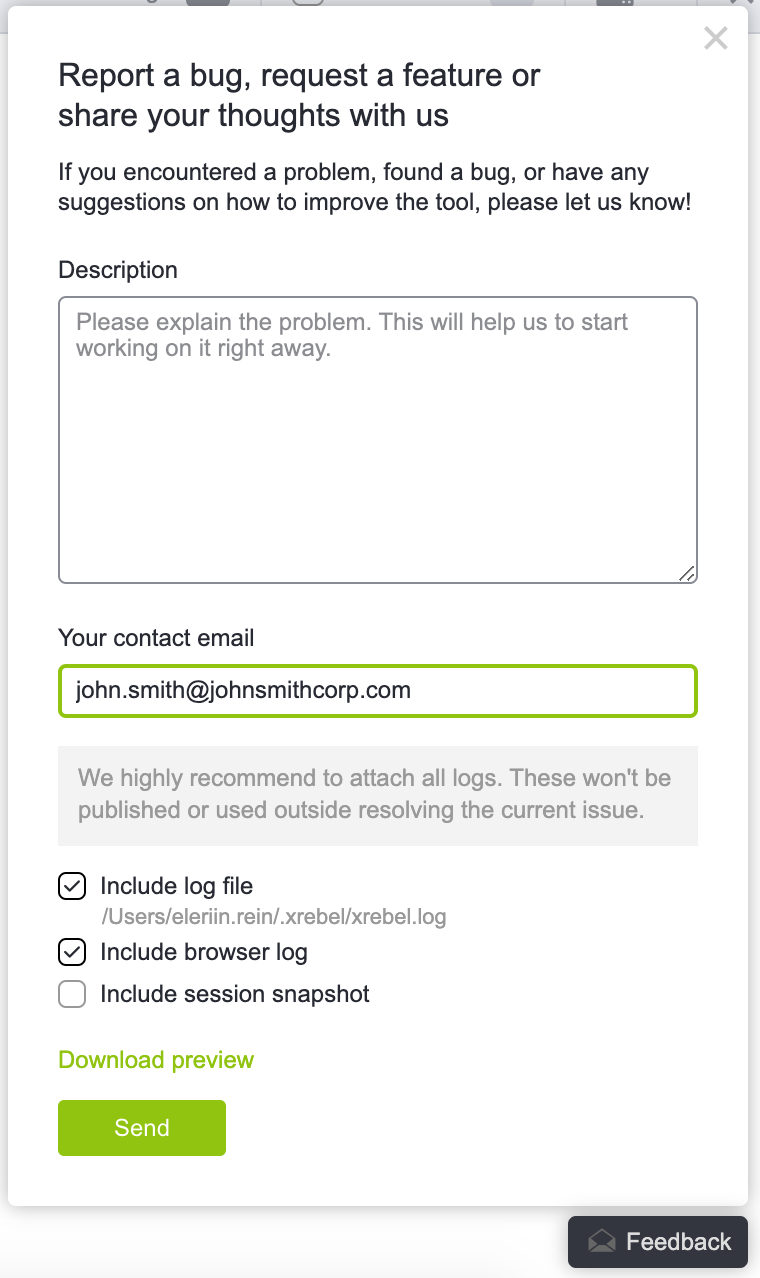
The following items can be edited and configured when sending feedback:
Description allows you to detail the suggestion or describe the specifics when encountering a bug.
Your email specifies the email address that the XRebel team can use to get in touch with you. This defaults to the email address used during license activation.
Include log files includes your current XRebel log files with the feedback. You can see the full path to your log files below this option. This option is enabled by default.
Include browser log includes your current browser log file and sends it with the feedback. This is useful when investigating bugs.
Include session snapshot includes your current application session snapshot and sends it with the feedback.
Download preview allows you to download the exact same package archive that will be sent with the current feedback.
Pressing Send will send the full feedback package with the logs archive.
Settings
Settings are used for configuring XRebel notifications and optional features.
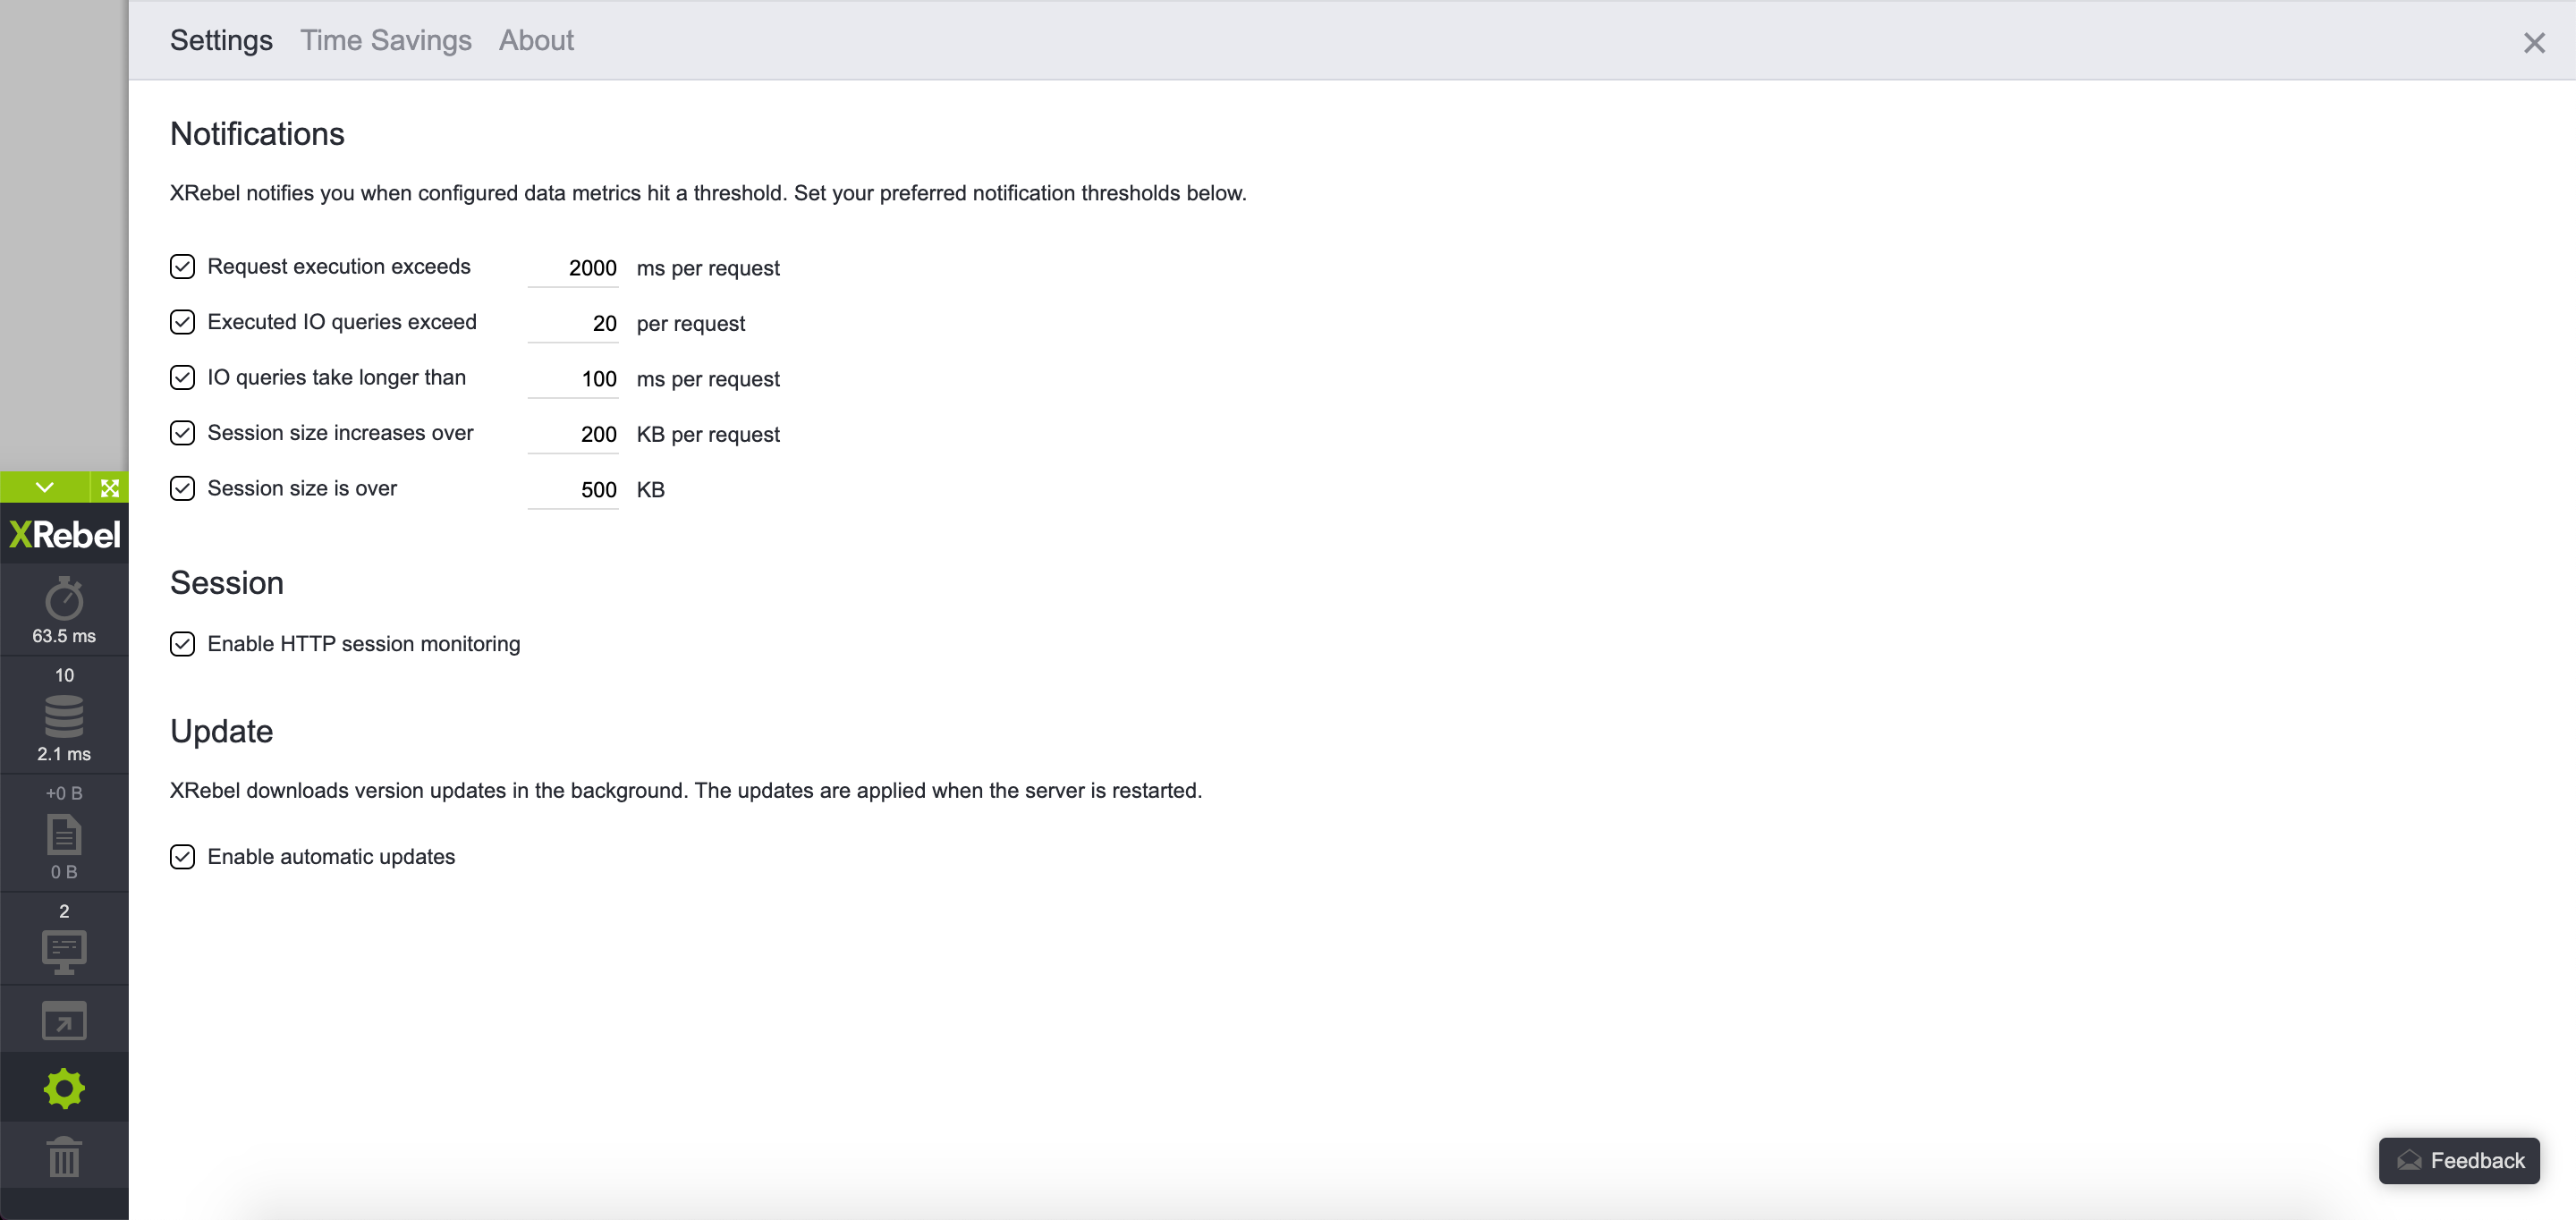
XRebel will call your attention to these events when the defined thresholds are hit. The following thresholds are available for configuration:
Request execution exceeds 200 ms per request. The default value is
200 ms. The user will be notified when the time request execution time exceeds the threshold value.Executed IO queries exceed 20 per request. The default value is
20queries. The user will be notified if the number of executed queries per request exceed the threshold value.IO queries take longer than 100 ms per request. The default value is
100 ms. If the query processing time is below the threshold, the user will be notified.Session size increases over 200 KB per request. The default value is
200 KB. The user will be notified when the session size exceeds the thresholds upon a new request. This setting is displayed only when Session is enabled.Session size is over 500 KB. The default value is
500 KB. Once the total session size exceeds the threshold value, the user will be notified. This setting is displayed only when Session is enabled.
Other configurable settings include:
Enable HTTP session monitoring (disabled by default) – enables the Session module for XRebel.
Enable automatic updates (enabled by default) – allows XRebel to download new versions in the background and then automatically apply them on server restarts.
About
The About page contains details for your current XRebel version and license information.
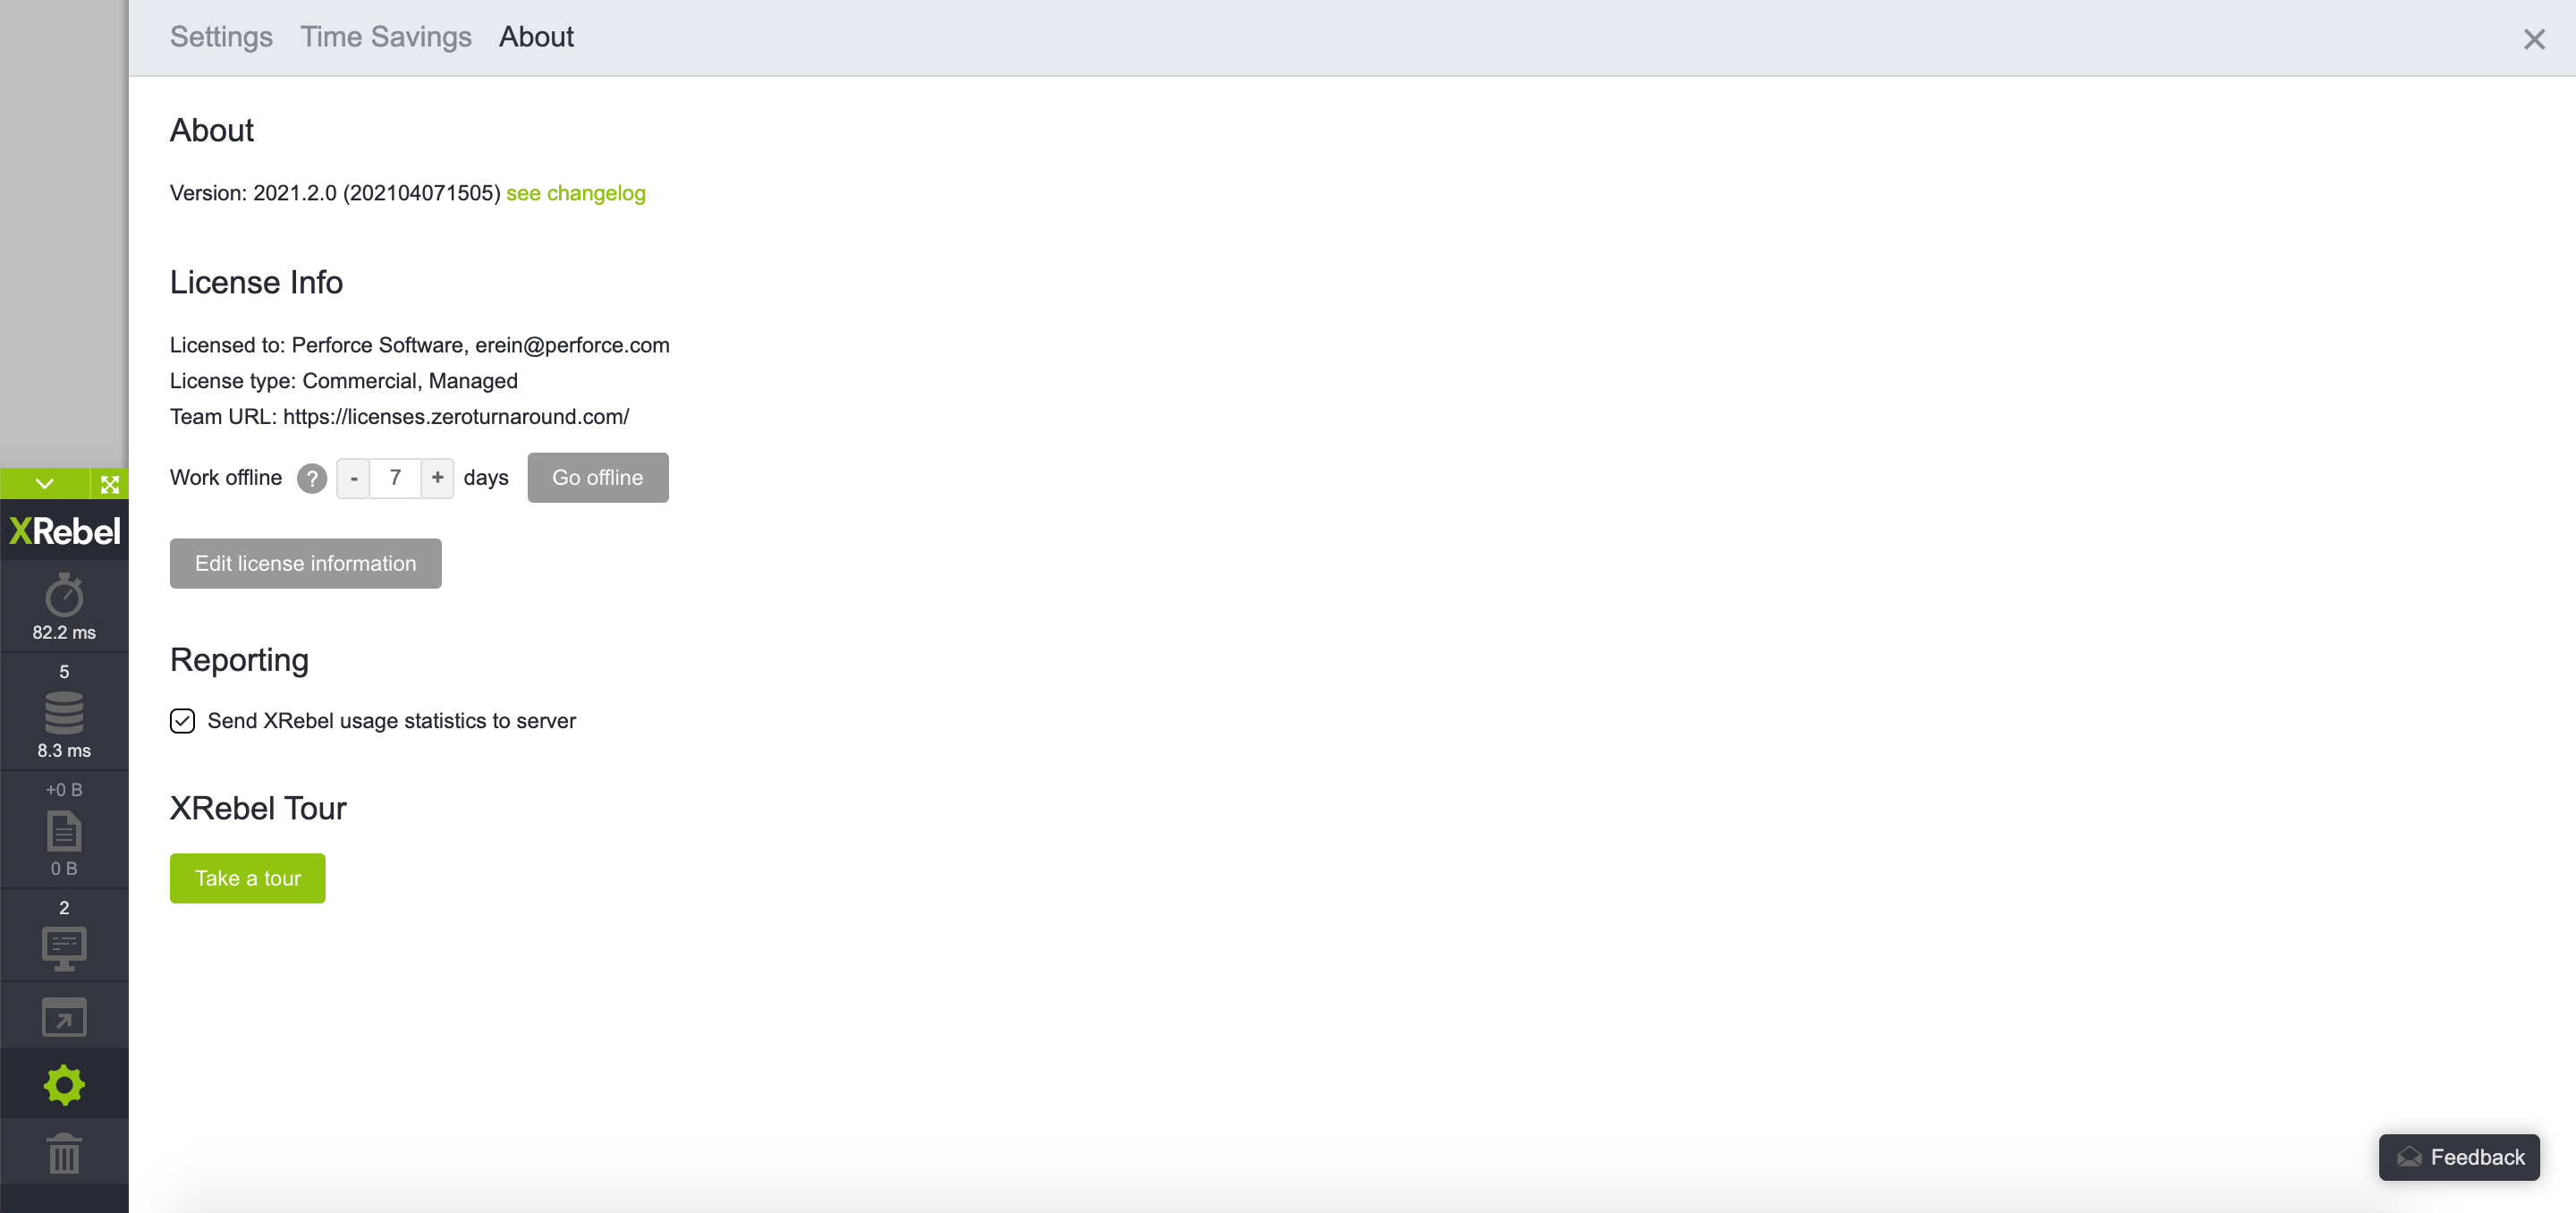
About section contains information about your current XRebel version.
License info section details the current license information. Pressing the Edit license information opens the license activation popup. When using a license served up by the Rebel Licenses or Rebel Licenses On-Premise, this section also displays the Work offline switch. Offline mode allows a developer to go offline, i.e. not be dependent upon the license service for a set amount of time. Read more.
Reporting allows you to disable sending XRebel usage statistics to Perforce. This option is enabled by default.